====== Test Page ======
==== Image Map ====
Disadvantage: when the image is rescaled, the image map is not. So the hot spots with the links are not where they are supposed to be.
 ==== Relative Positions (for smartphones etc.) ====
Advantage: position of the hot spots scales with the size of the image displayed.
==== Lists ====
==== Relative Positions (for smartphones etc.) ====
Advantage: position of the hot spots scales with the size of the image displayed.
==== Lists ====
As mentioned before, the data that is transmitted consists of 40 bits. 2 bytes for the relative humidity, 2 bytes for the temperature and 1 byte (check-sum) to check for finding errors in the transmission. The principle becomes clearer when looking at an example transmission:
\[\mathrm{0000\; 0010\; 1000\; 1100\;\; 0000\; 0001\; 0101\; 1111\;\; 1110\; 1110}\]
\[\mathrm{\;\;\;\;\;\;\;\;\; Humidity \;\;\;\;\;\;\;\;\;|\;\;\;\;\;Temperature \;\;\;\;\;\;\;|\; check-sum}\]
-
The first two bytes contain the relative humidity data, converted to decimal, that gives:
\[\mathrm{0000\; 0010\;\; 1000\; 1100_{2}} → 652_{10}\]
To obtain the relative humidity RH in percent, the value must be divided by 10:
\[RH = \frac{\mathrm{652}}{\mathrm{10}} = \mathrm{65.2\;\%}\]
-
For the temperature it works in a similar way. The binary gets converted to decimal and is divided by 10 to obtain the temperature in °C:
\[\mathrm{0000\; 0001\;\; 0101\; 1111_2 → 351_{10}}\]
\[T = \mathrm{\frac{351}{10} = 35.1 °C}\]
Unlike relative humidity, the temperature can be below 0 (negative). If that is the case, the first digit of the first temperature byte (byte 3) is a 1.
-
The last byte contains the 8 least significant bits (LSB) of the sum of both humidity and both temperature bytes:
\[\mathrm{0000\; 0010 + 1000\; 1100 + 0000\; 0001 + 0101\; 1111 = 1110\; 1110}\]
After receiving the data, if the last byte (check-sum) is different from the 8 LSBs of the sum of the other 4 bytes, there was an error in the transmission. The MCU can thus check if the data was transmitted correctly.
==== Changing Fonts and Colours in the text ====
The function Serial.begin() starts the serial connection.
Arduino IDE style Fonts for functions etc:
=== Reoccurring Functions, Templates ===
InlineText
bold
TextInCourierNew
TextInOrange

Black:
TextInBlack

Orange:
TextInOrange

Blue:
TextInBlue

Green:
TextInGreen


Hexadecimal Color Codes:
Orange (Objects, functions): #CD5307
Blue (Variables): #0098A3
Green (preprocessor commands): #5A6B0F
Basic: Text
**Methods**
Class.method()
\\
Class.method()
\\
Class.method()
**Loops and control structures**
\\
for()
\\
if()
\\
setup()
\\
loop()
**Variables**
const int
\\
String
\\
long
\\
unsigned int
\\
uint8_t
**Preprocessor Commands**
#include
\\
#define
Functions
delay()
\\
printAddress()
===== Links =====
↩ Back to the main page
Back to the top ⤴
Main Page Sensors
Default Link Color RGB: #2E71B8
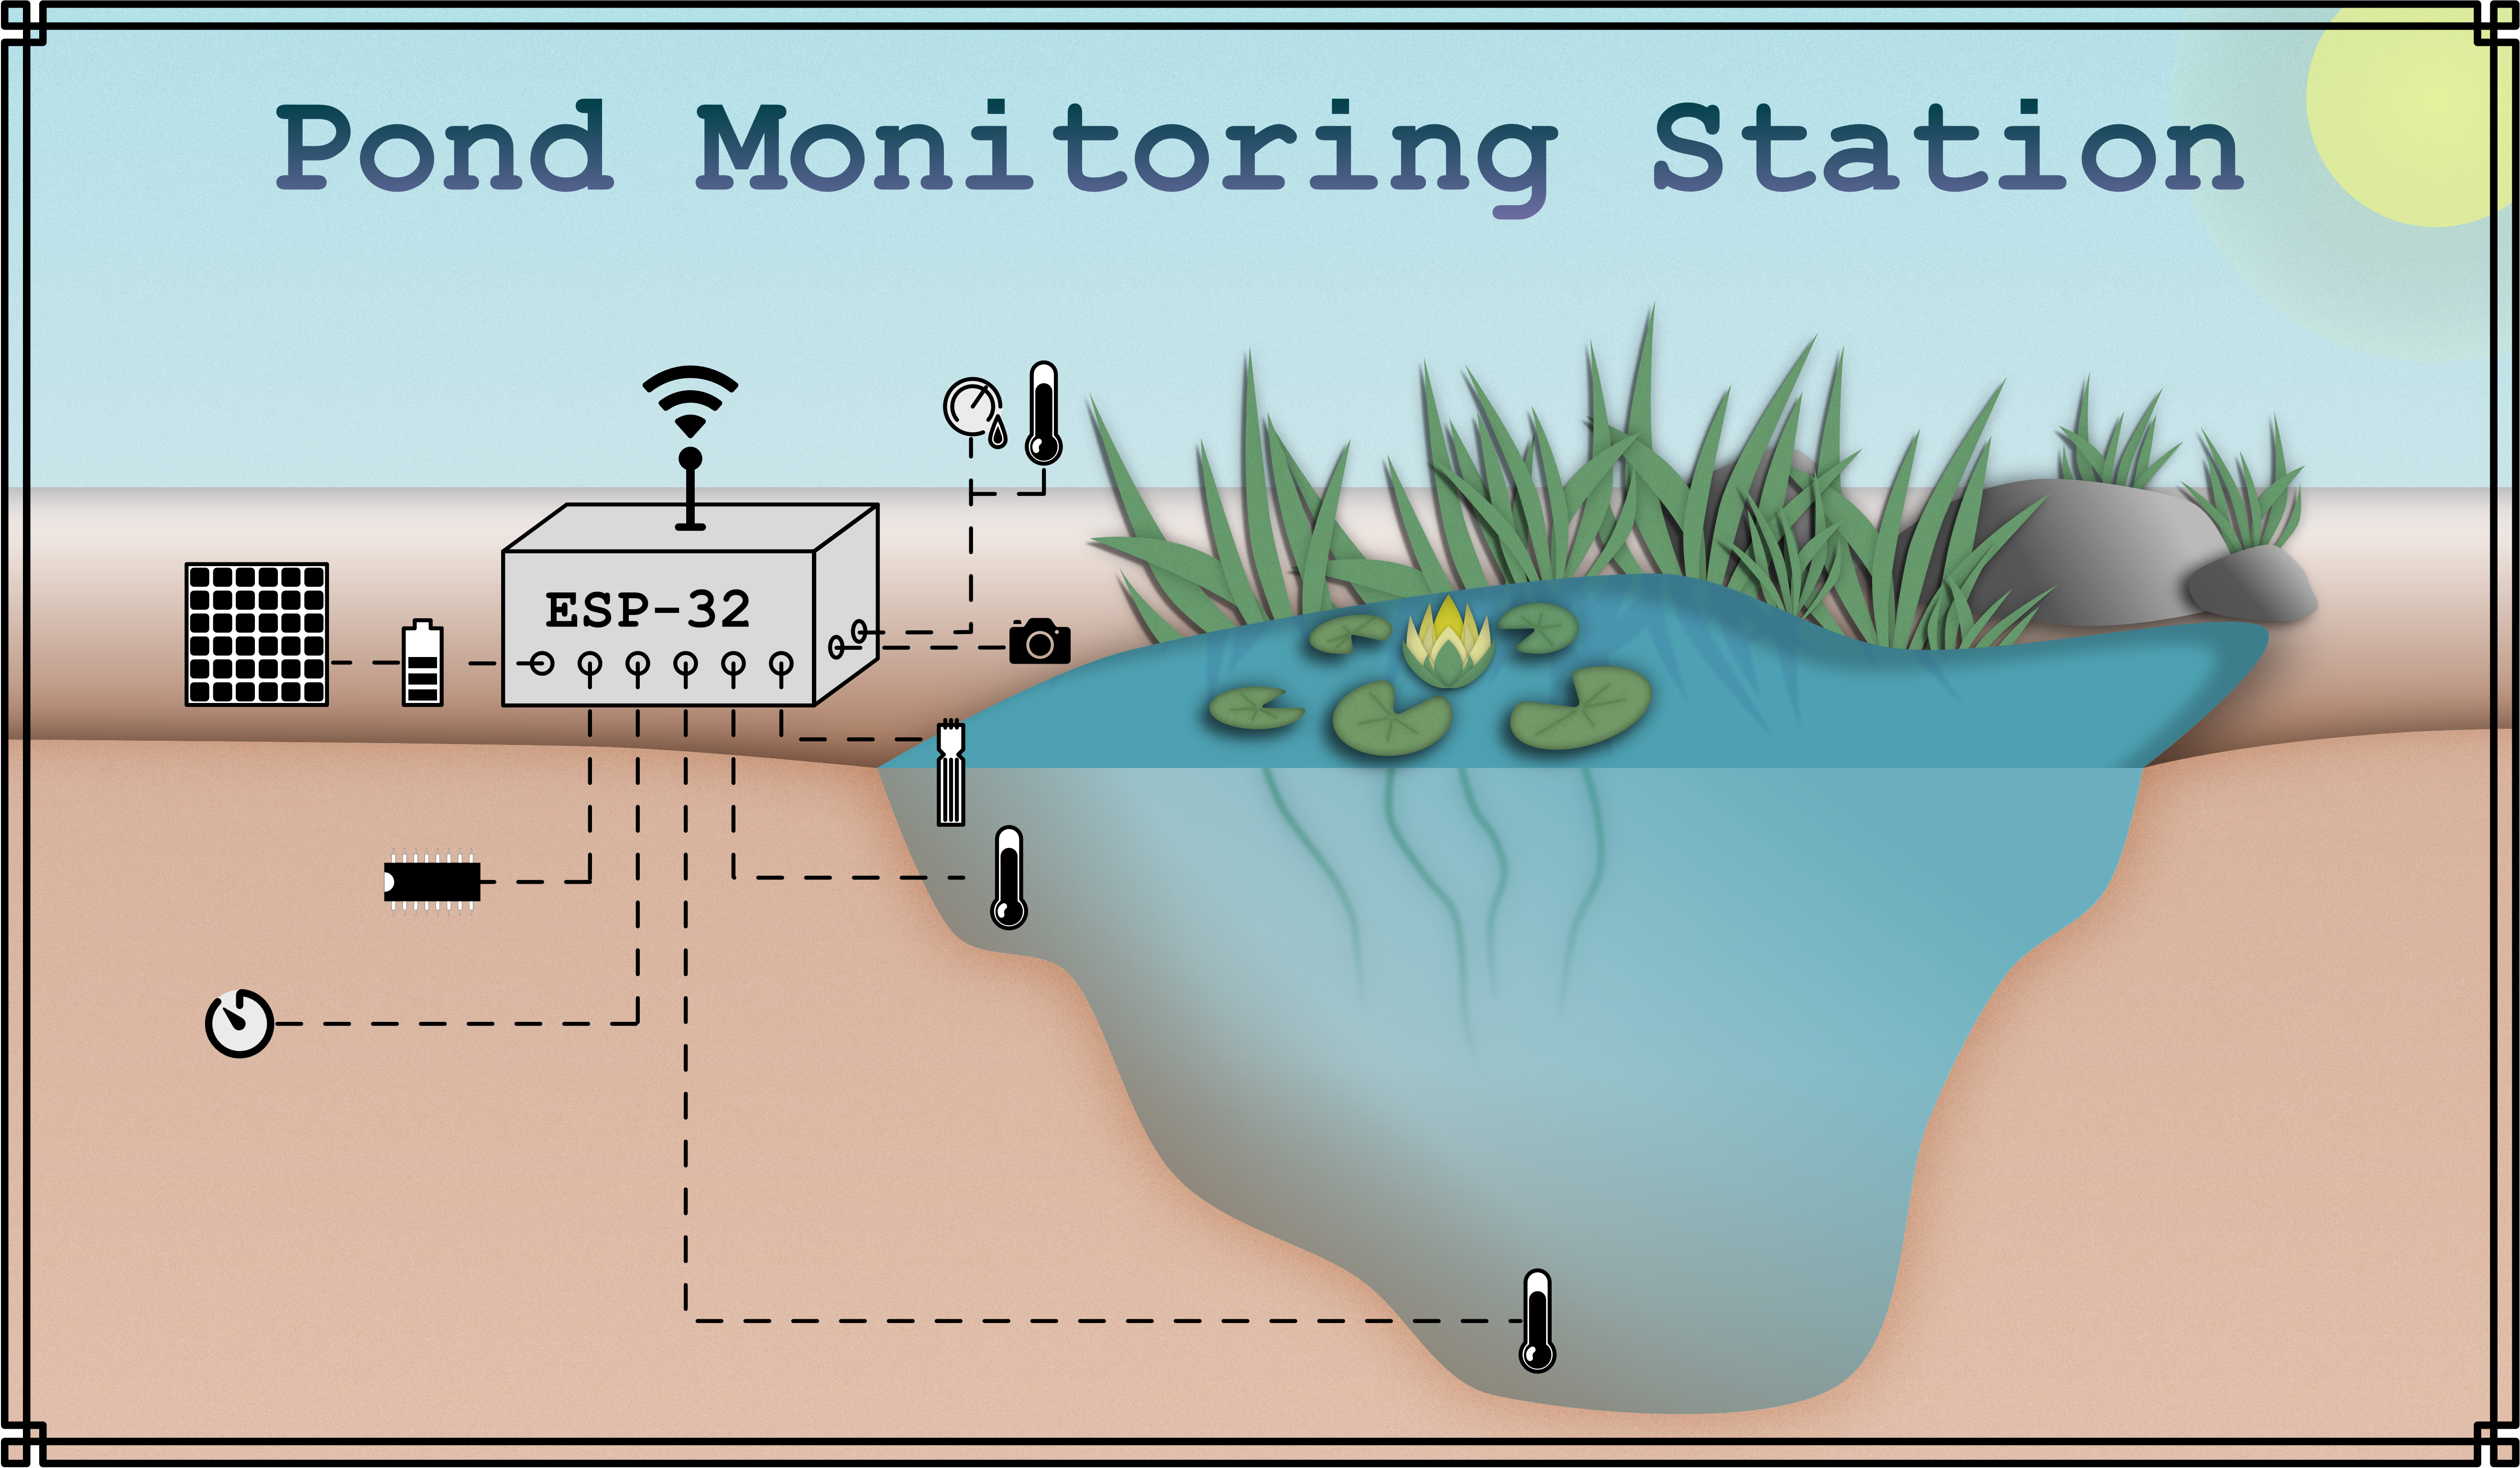
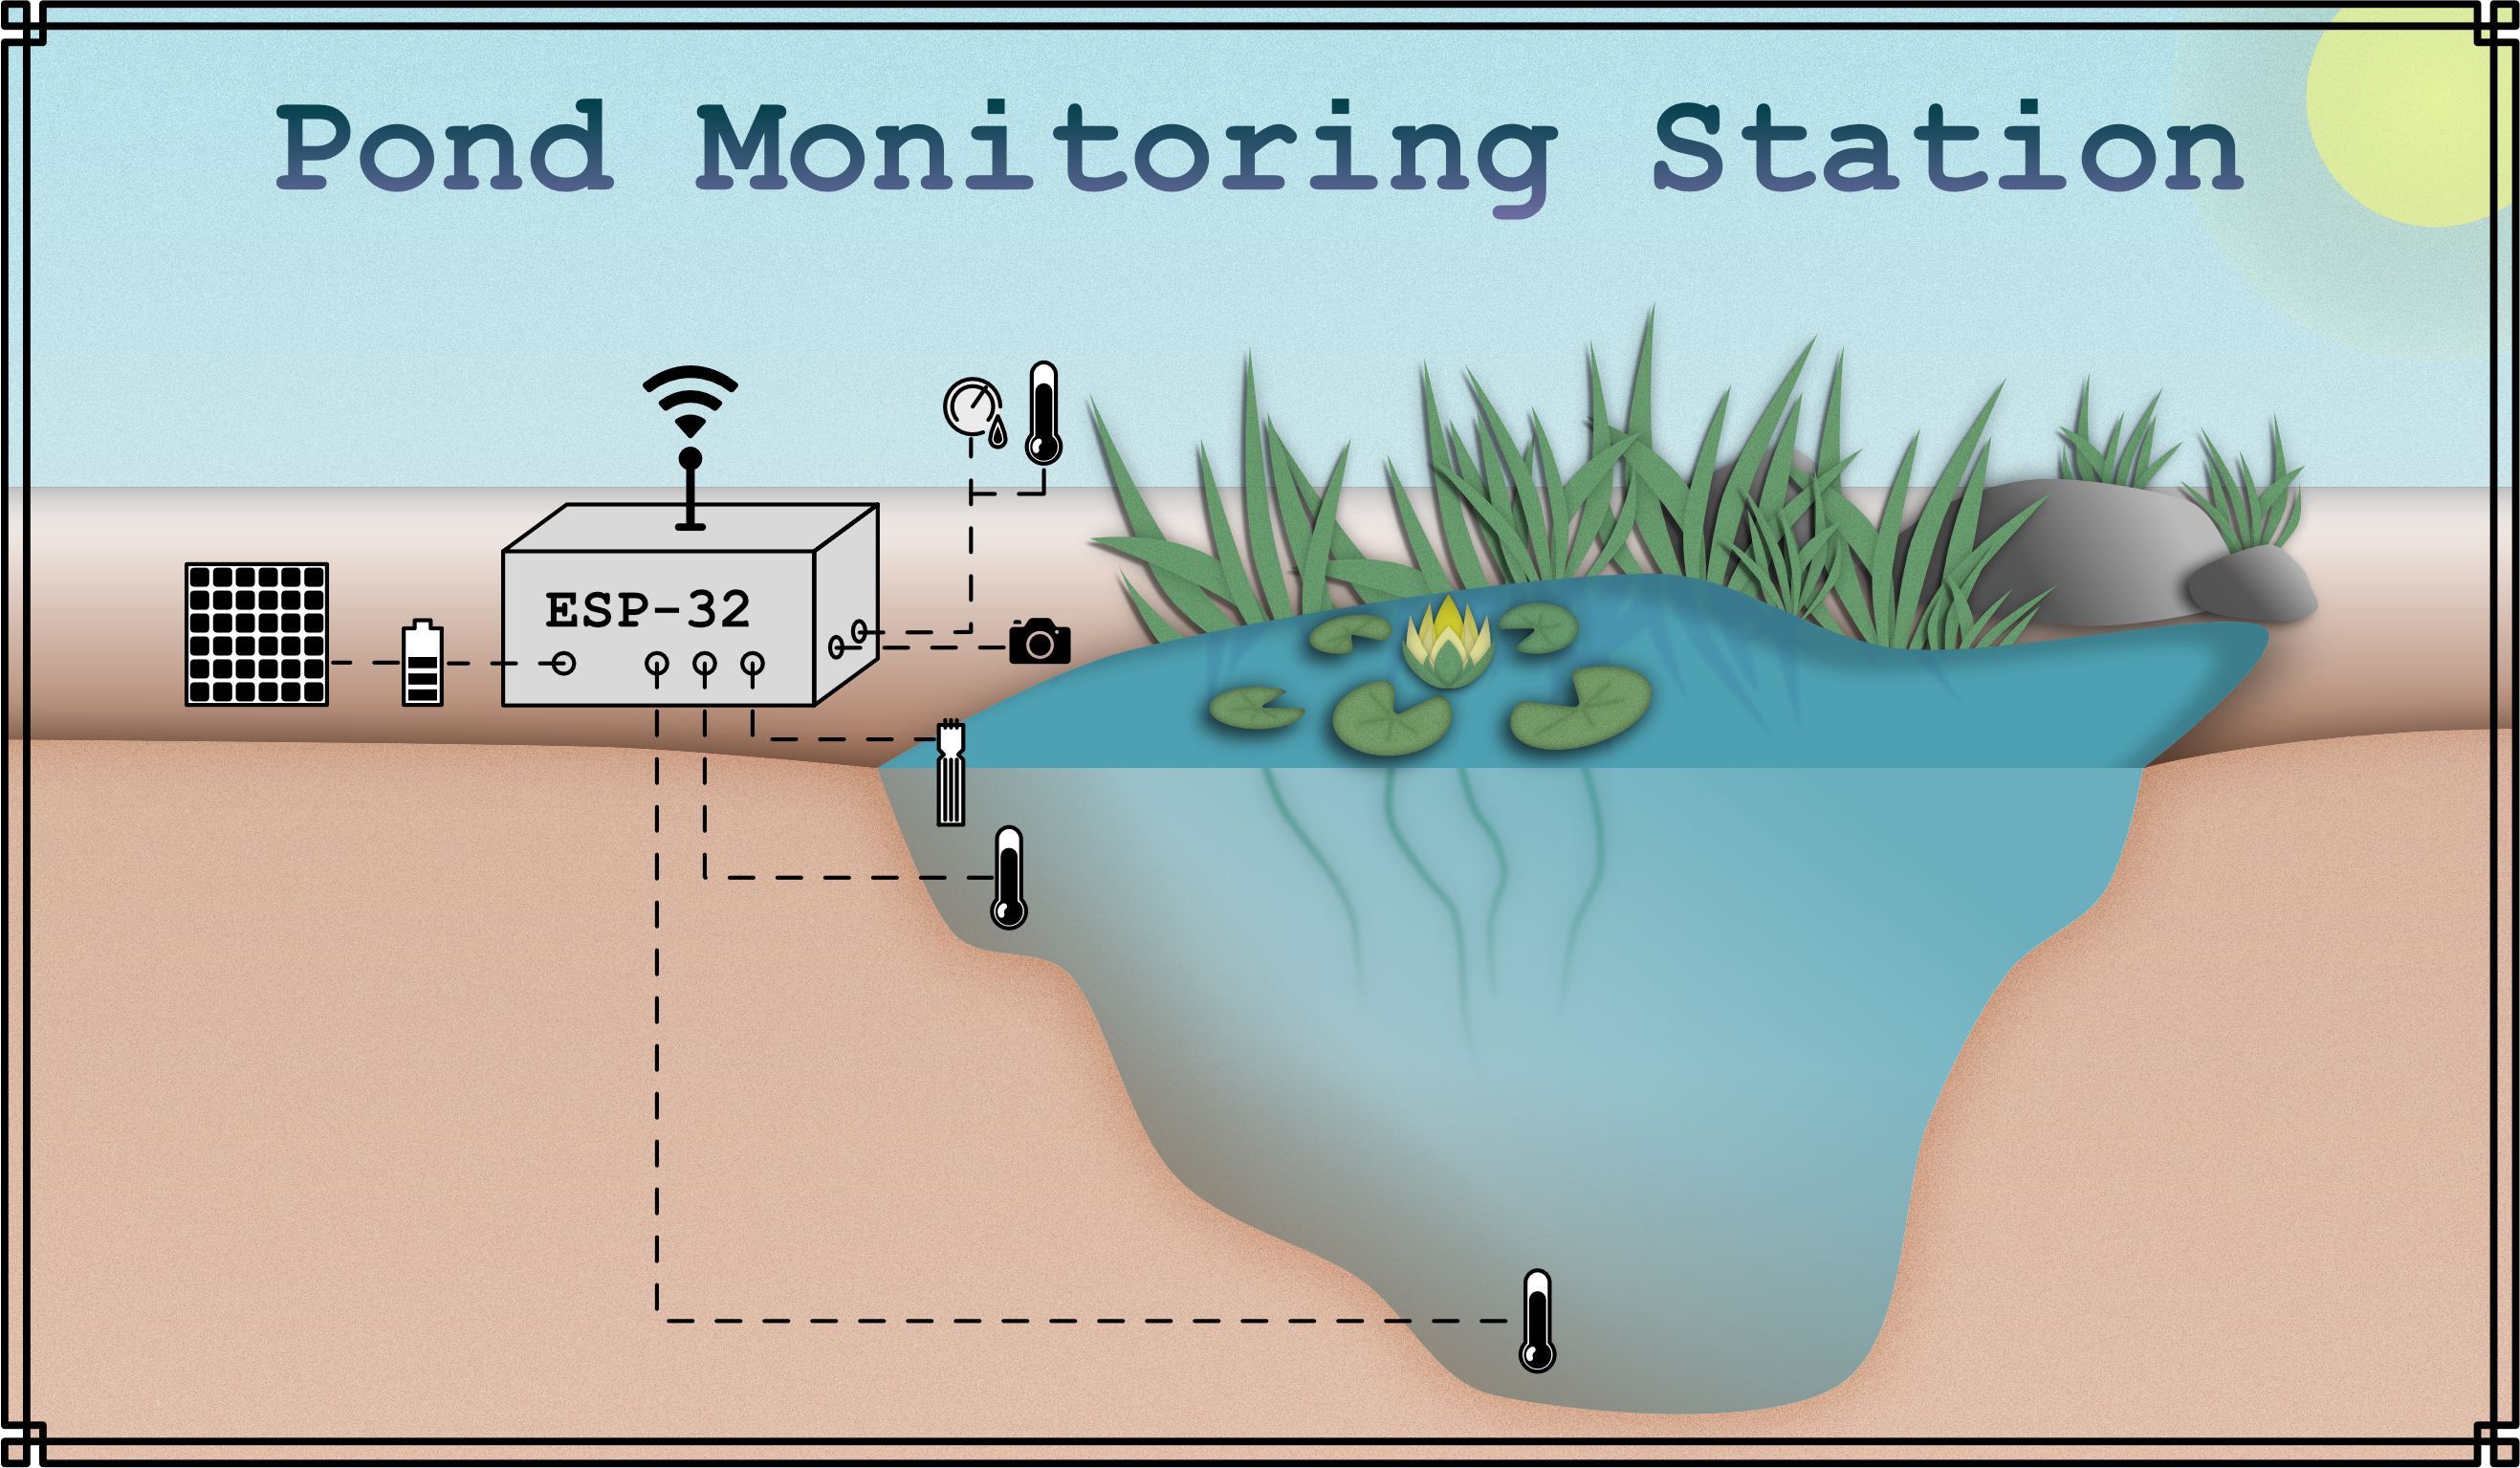
===== Materials and Methods =====
==== Sensors and modules that are used ====
Further information on the sensors and devices used can be seen in their respective pages:
**[[dht22|DHT-22 Air Temperature and Humidity Sensor]]**
**[[ds18b20|DS18B20 Waterproof Temperature Sensor]]**
**[[SN74HC595N|SN74HC595(N) Shift Register]]**
**[[DS3231RTC|DS3231 Real Time Clock]]**
==== Programming Deep Sleep and MQTT ====
**[[amc2020:group_n:deepsleep|ESP32 Deep Sleep]]**
**[[amc2020:group_n:wifi|Testing Wifi and MQTT]]**
==== Setup of the ESP32 and the Modules ====
^{{:amc2020:group_n:esp32_sensors_rtc_pn2222.png?direct&500|Figure 2}}^
|**//Figure 2//** Graphic on how to set up the ESP32 and the modules and parts.|
^{{:amc2020:group_n:esp32_wiring.png?direct&800|Figure 3}}^
|**//Figure 3//** Schematic of the connections between ESP32 and the modules and parts.|
===== Results =====
^ {{:amc2020:group_n:pond_monitoring_station_data_logger_graphana_light_theme.png?800&direct|Figure 4}} ^
| **//Figure 4//** Measurement results of the DHT-22 and DS18B20 sensors visualized in Grafana. |
{{:amc2020:group_n:pond.jpg?direct&800|}}