Table of Contents
Practical Evaluation: Building an End-to-End IoT Temperature Monitoring Stack
Context
Over the past three days, you built a complete IoT data pipeline using an ESP32, an analog soil moisture sensor, WiFi, MQTT, Node-RED, InfluxDB, and Grafana.
You practiced each layer of the IoT stack:
- Connecting a sensor to a microcontroller
- Reading sensor values in Arduino code
- Applying simple logic to sensor readings
- Controlling an LED based on a condition
- Connecting the ESP32 to WiFi
- Publishing data through MQTT using the PubSubClient library
- Receiving MQTT messages in Node-RED
- Pre-processing incoming values in Node-RED
- Writing processed values into InfluxDB
- Connecting Grafana to InfluxDB
- Creating a Grafana dashboard to visualize sensor measurements
For this evaluation, you will repeat the same IoT stack, but with a different sensor: the DS18B20 digital temperature sensor.
The goal is not to test memorization. You are allowed to use the provided schematic, diagrams, starter code, previous workshop notes, and examples.
The goal is to demonstrate that you understand how the parts of the IoT stack connect and that you can adapt the workflow to a new sensor.
Evaluation Task
Main Objective
Build a working IoT temperature monitoring system using the ESP32 and DS18B20 temperature sensor, then send the temperature data through the full IoT stack:
DS18B20 → ESP32 → WiFi → MQTT → Node-RED → InfluxDB → Grafana
At the end of the evaluation, your system should:
- Read temperature data from the DS18B20 sensor.
- Apply simple logic to the temperature value.
- Turn an LED on or off based on a temperature condition.
- Connect the ESP32 to WiFi.
- Publish temperature readings to an MQTT topic.
- Subscribe to the MQTT topic in Node-RED.
- Convert or validate the incoming value in Node-RED.
- Store the temperature measurement in InfluxDB.
- Connect Grafana to InfluxDB.
- Create a Grafana dashboard showing the temperature data.
Provided Resources
You may use the following resources during the evaluation:
- DS18B20 wiring schematic
- ESP32 pinout diagram
- MQTT topic structure example
- Node-RED flow reference diagram
- InfluxDB configuration notes
- Grafana dashboard setup notes
- Starter Arduino code
- Previous workshop code
- The workshop examples
- Internet search for syntax, library usage, and troubleshooting
You are expected to understand and adapt the materials, not reproduce them from memory.
Starter Code
The starter code gives you the basic structure of the program.
It does not contain the complete solution. You must complete the missing parts and adapt the code to your own MQTT topic, pin choices, threshold value, and setup.
#include <WiFi.h>
#include <PubSubClient.h>
#include <OneWire.h>
#include <DallasTemperature.h>

// TODO: Add WiFi credentials
const char* SSID = "YOUR_WIFI_NAME";
const char* PASSWORD = "YOUR_WIFI_PASSWORD";

// TODO: Add MQTT broker address
const char* MQTT_HOST = "YOUR_MQTT_BROKER_IP";
const int MQTT_PORT = 1234;

// TODO: Define MQTT topic
const char* MQTT_TOPIC = "workshop/student-name/temperature";

// TODO: Define pins
#define ONE_WIRE_BUS 4
#define LED_PIN 2

WiFiClient wifi;
PubSubClient mqtt(wifi);

OneWire oneWire(ONE_WIRE_BUS);
DallasTemperature temp_sensor(&oneWire);

void setup_wifi() {
  // TODO: Connect to WiFi

  // TODO: Print connection status

  // TODO: Print assigned IP address
}

void reconnect_mqtt() {
  // TODO: Check MQTT connection

  // TODO: Reconnect if disconnected

  // TODO: Print MQTT connection status
}

void setup() {
  Serial.begin(115200);

  pinMode(LED_PIN, OUTPUT);

  temp_sensor.begin();

  setup_wifi();

  mqtt.setServer(MQTT_HOST, MQTT_PORT);
}

void loop() {
  if (!mqtt.connected()) {
    reconnect_mqtt();
  }

  mqtt.loop();

  // Request temperature from DS18B20
  temp_sensor.requestTemperatures();

  // Read temperature in Celsius
  float temperatureC = temp_sensor.getTempCByIndex(0);

  // Check whether the reading is valid
  if (temperatureC == DEVICE_DISCONNECTED_C) {
    Serial.println("Error: DS18B20 sensor not detected or reading failed");
    delay(2000);
    return;
  }

  // TODO: Print temperature to Serial Monitor

  // TODO: Add LED threshold logic

  // TODO: Convert temperature value to MQTT payload

  // TODO: Publish temperature to MQTT topic
}
Starter Code Expectations
Your final code should include:
- DS18B20 initialization
- Temperature reading in degrees Celsius
- Basic error handling for invalid sensor readings
- LED control based on a temperature threshold
- WiFi connection
- MQTT broker connection
- MQTT publishing
- Clear Serial Monitor output
- Basic comments explaining the main sections
—
Hardware and Software
Hardware
The is the list of component that you need in order to complete this evaluation:
- ESP32 development board
- DS18B20 temperature sensor
- 4.7kΩ pull-up resistor
- Breadboard and jumper wires
- LED (use the built-in LED)
- 220Ω current-limiting resistor for LED
- USB cable
- Computer with PlatformIO
Software and Services
- VS Code with PlatformIO extension
- Required libraries, later on this page, you will be instructed to install them:
- OneWire
- DallasTemperature
- PubSubClient
- WiFi library for ESP32, which is already included
- MQTT broker
- Node-RED
- InfluxDB
- Grafana
Practical Milestones, Requirements, and Deliverables
This section combines the required system behavior, the checkpoint structure, and the expected deliverables.
Each milestone should be demonstrated before moving to the next layer of the IoT stack.
The first milestone focuses only on the physical construction of the circuit. Students should not start debugging code before the sensor, resistors and ESP32 are correctly connected on the breadboard.
Milestone 1: Physical Breadboard Connection of the DS18B20 and ESP32
Required Behavior
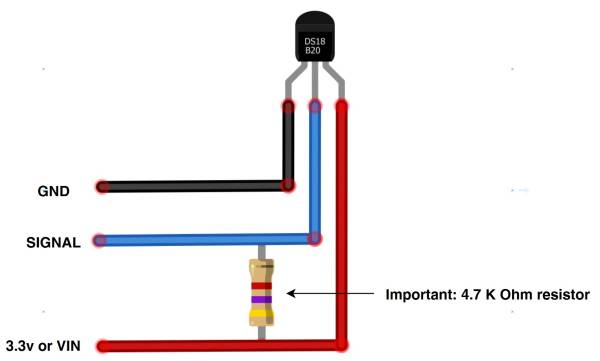
1. The student must physically connect the DS18B20 temperature sensor to the ESP32 using the breadboard.
2. The circuit must include the required 4.7kΩ pull-up resistor between the DS18B20 data line and the power line.
At this stage, the focus is only on correct physical wiring.
No sensor reading, WiFi connection, MQTT publishing, Node-RED flow, InfluxDB storage, or Grafana dashboard is required yet.
Required Deliverables
You must show:
- ESP32 placed or connected correctly to the breadboard
- DS18B20 connected to the ESP32
- DS18B20 VCC connected to the correct voltage line
- DS18B20 GND connected to ground
- DS18B20 data pin connected to the selected ESP32 GPIO pin
- 4.7kΩ pull-up resistor connected between VCC and the DS18B20 data line
- LED connected to an ESP32 GPIO pin
- LED current-limiting resistor connected correctly
- Shared ground between all components
- Wiring that follows the provided schematic
Checkpoint Evidence
The student demonstrates that:
- They can identify the DS18B20 pins: VCC, GND, and DATA
- They can identify the ESP32 GPIO pin used for the DS18B20 data line
- They can explain the purpose of the 4.7kΩ pull-up resistor
- They can identify the GPIO pin used for the LED
- The breadboard wiring is organized enough to be inspected
- The circuit matches the provided schematic before code is uploaded
Instructor Check
Before the student continues, the instructor should confirm:
- No power and ground lines are reversed
- The DS18B20 data line is not connected directly to VCC or GND
- The pull-up resistor is placed correctly
- The LED has a current-limiting resistor
- The ESP32, sensor, and LED share a common ground
Milestone 2: DS18B20 Sensor Reading
Required Behavior
The ESP32 must read temperature data from the DS18B20 sensor.
The temperature value should be read in degrees Celsius.
Example expected Serial Monitor output:
Temperature: 24.75 °C
Required Deliverables
The student or group must show:
- Arduino code that initializes the DS18B20
- Required DS18B20 libraries included
- Correct GPIO pin configured for the DS18B20 data line
- Temperature reading requested from the sensor
- Temperature value printed to the Serial Monitor
Checkpoint Evidence
The student demonstrates that:
- Temperature values appear in the Serial Monitor
- The values are realistic
- The code uses the same ESP32 GPIO pin as the physical circuit
- The student can explain the difference between connecting the sensor and reading the sensor in code
- The student can identify whether a problem is likely caused by wiring or code
Milestone 3: Conditional Logic and LED Control
Required Behavior
The ESP32 must apply a simple condition to the temperature value and control an LED based on that condition.
Example condition:
If temperature is above 30°C, turn the LED on.
Otherwise, turn the LED off.
Students may choose a different threshold, but the threshold must be clearly stated in the code comments or final explanation.
Required Deliverables
The student or group must show:
- LED connected to the ESP32
- LED GPIO pin correctly defined in the Arduino code
- Temperature threshold implemented in the Arduino code
- LED turning on or off according to the condition
- Clear explanation of the chosen threshold
Checkpoint Evidence
The student demonstrates that:
- The LED responds to the temperature condition
- The condition is based on the DS18B20 reading
- The threshold value is visible in the code
- The student can explain why the LED turns on or off
- The student can distinguish between a sensor-reading issue and an LED-control issue
Milestone 4: WiFi Connection and IP Address
Required Behavior
The ESP32 must connect to the provided WiFi network.
The device should print the assigned IP address to the Serial Monitor after connecting.
Example expected Serial Monitor output:
Connected to WiFi
IP address: 192.168.1.42
Required Deliverables
The student or group must show:
- WiFi credentials added to the Arduino code
- ESP32 successfully connected to WiFi
- IP address printed in the Serial Monitor
- Basic connection status messages
- Code structure that separates WiFi setup from the main loop
Checkpoint Evidence
The student demonstrates that:
- The ESP32 receives an IP address
- The Serial Monitor confirms WiFi connection
- The student can explain why WiFi is needed before MQTT can work
- The student can identify whether the ESP32 is connected to the network
—
Milestone 5: MQTT Connection and Temperature Publishing
Required Behavior
The ESP32 must publish the temperature value to an MQTT topic.
Suggested topic format:
workshop/student-name/temperature
Example MQTT payload:
24.75
The payload should contain the temperature value as a number or a numeric string that can be processed in Node-RED.
Required Deliverables
The student or group must show:
- MQTT broker address configured in the Arduino code
- MQTT topic configured in the Arduino code
- ESP32 connected to the MQTT broker
- Temperature values published to MQTT
- Serial Monitor output showing MQTT publishing activity
- Payload format suitable for Node-RED processing
Checkpoint Evidence
The student demonstrates that:
- The ESP32 connects to the MQTT broker
- Temperature values are published repeatedly
- The MQTT topic is clear and unique to the student or group
- The MQTT payload contains only the value or a clearly structured value
- The student can explain the difference between WiFi connection and MQTT connection
Milestone 6: Node-RED MQTT Subscription and Value Processing
Required Behavior
Create a Node-RED flow that receives the MQTT temperature data.
The flow must:
- Subscribe to the MQTT topic.
- Receive the temperature value.
- Convert the incoming payload into a number if needed.
- Optionally check that the value is valid.
- Prepare the value for writing into InfluxDB.
Recommended nodes:
- MQTT input node
- Debug node
- Function node or Change node for value conversion
- InfluxDB output node
Required Deliverables
The student or group must show:
- Node-RED MQTT input node subscribed to the correct topic
- Debug output showing the incoming MQTT payload
- Node-RED logic that converts the payload into a number
- Processed value ready for InfluxDB
- Organized and readable Node-RED flow
Checkpoint Evidence
The student demonstrates that:
- MQTT messages from the ESP32 are visible in Node-RED
- The payload is converted from a string to a number if necessary
- The debug panel shows the processed value
- The student can explain the role of each node in the flow
Milestone 7: Grafana Dashboard
Required Behavior
Create a Grafana dashboard that visualizes the temperature data from InfluxDB.
The dashboard should include at least one panel showing temperature over time.
Recommended panel title:
DS18B20 Temperature Reading
The graph should update as new MQTT messages are published and stored.
Required Deliverables
The student or group must show:
- InfluxDB configured as a Grafana datasource
- Query that retrieves the temperature data
- Dashboard panel displaying temperature over time
- Clear panel title
- Correct or appropriate unit, such as degrees Celsius
Checkpoint Evidence
The student demonstrates that:
- Grafana can access the InfluxDB datasource
- Temperature values appear in a dashboard panel
- The graph updates over time
- The student can explain how Grafana receives the data indirectly through InfluxDB
Milestone 8: Final System Explanation
Required Behavior
The student must briefly explain the full data path:
DS18B20 → ESP32 → WiFi → MQTT → Node-RED → InfluxDB → Grafana
The explanation does not need to be long. It should show that the student understands what each part of the system does.
Required Deliverables
The student or group must explain:
- What the DS18B20 measures
- How the DS18B20 is physically connected to the ESP32
- What the ESP32 does
- Why WiFi is needed
- What MQTT is used for
- What Node-RED does
- Why the data is stored in InfluxDB
- What Grafana displays
Checkpoint Evidence
The student demonstrates that:
- They can describe the system from sensor to dashboard
- They can identify where a problem is happening in the stack
- They can distinguish between hardware, firmware, network, MQTT, Node-RED, database, and dashboard issues
- They can explain at least one troubleshooting step they used