Table of Contents
Portable Meteorological Measurement Station
Microclimatic measurements for agricultural applications

Picture: Marie Christine Klanten
Authors
Group F:
- Veronika Skwirut
- Marie Christine Klanten
- Vanessa Meinert
Introduction
Incentive and planned application
Klanten
Plant growth, and therefore agriculture and gardening, are highly dependent on the surrounding climatic conditions. Not only at a regional, but also on a very small, microclimatic scale. Sometimes data measured by weather stations nearby are not precise enough to estimate the local conditions.
For example, the growth of a variety of fungi species is heavily dependent on the local microclimatic conditions within the planted crops. They require certain temperature ranges, relative humidity, and amount of precipitation to be able to grow. If we are able to measure, whether these conditions are met in an area planted with certain crops, the amount of fungicides required can be reduced dramatically.
We are planning to design a portable meteorological measurement station, to measure the temperature, relative humidity, soil moisture, amount of precipitation and solar radiation within a field or garden.
By knowing the exact conditions in between the plants, we will hopefully be able to draw conclusions about the plants needs and health conditions. Thus, we would be able to optimize irrigation and the use of pesti- or fungicides by adapting it to the plants needs in the specific area.
Agriculture and gardening could be made much more efficient.
Attempt 1: Arduino Uno Board
Test the sensors and read data manually
https://store-cdn.arduino.cc/uni/catalog/product/cache/1/image/520x330/604a3538c15e081937dbfbd20aa60aad/a/0/a000066_featured_1_2.jpg
Material, Methods and Explanations of Sensors
General Material
- Jumper Wires
Measurement of Temperature and relative Humidity
Meinert
The DHT11 Temperature and Humidity Module is a common sensor module that gives serial data for temperature and relative humidity with an accuracy of ±1°C or ±1%, which makes it very precise.
Where is it used for?
The DHT11 is mainly used for local weather stations. Thus, in the sector of environmental monitoring and climate control it plays an important role. The module is able to measure temperatures between 0°C and 50°C and a relative humidity between 20% and 90%. This means that it is not possible to use it all over the world (see “Limitations”) but if measurements in this range should be done, the DHT11 is a good choice.
Technical facts
The module can be connected to an operating voltage between 3.3V to 5.5V DC and has an operating current of 0.3mA during measuring and 60uA in standby. The resolution of both, temperature and humidity are 16-bit. For the data pin, a 5K pull-up resistor is used. How the module is connected can be seen in the pictures below.
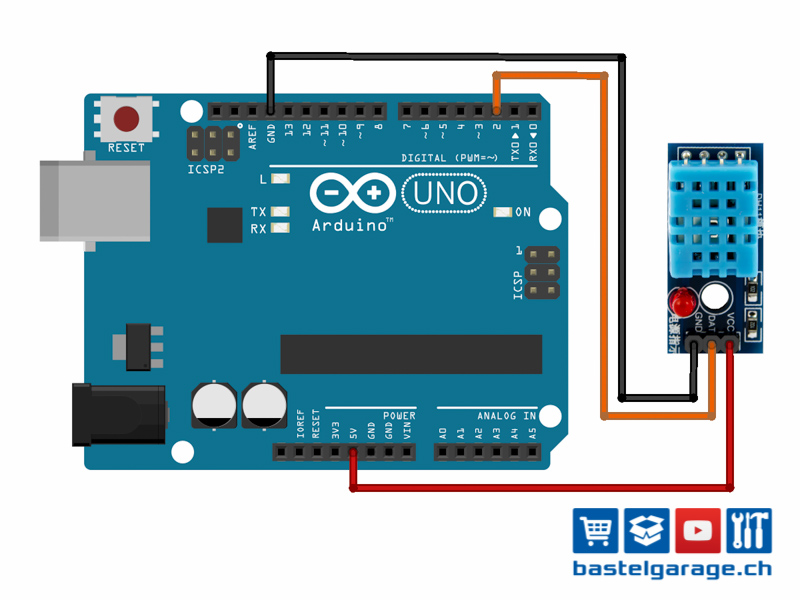
https://www.bastelgarage.ch/image/catalog/Blog/1_DHT11/20160425-DHT11_V1.0_Steckplatine.jpg
Before it can be used, the “DHT.h” library has to be installed. An instuction can be found here.
Limitations
Since the relative humidity is dependent on the temperature, it is important that the sensor is not affected by any heat sources like any near-by working electronic devices. This may lead to wrong values of the relative humidity. Therefore, the outcome data might be wrong if measurements are taken in a closed room with influences of different things.
Another limitation is that the module cannot be used in winter or in regions with low average values below 0°C as well as in regions where temperatures lay above 50°C like in the desert.
Furthermore, it cannot be used in foggy or tropical regions. Here, a relative humidity of up to 100% is achieved relatively often. A relative humidity below 10% is rather unusually but possible. Then the DHT11 would not be a good choice as well.
How to use the DHT11
The module has to be plugged in, like it is described in the picture below. In this example “Data” is connected to Pin 2, “Vcc” to 5V and “Ground” to GND of the Arduino UNO.
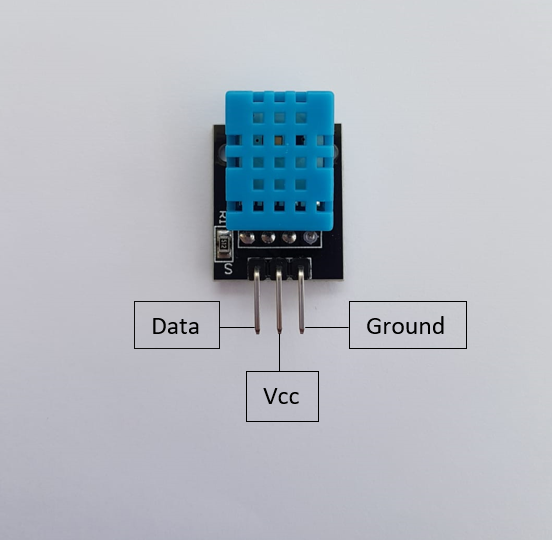
Picture:Vanessa Meinert
After the jumper wires are connected and the “DHT.h” library is installed, the module can be run with the following code.
Attemtion: It can take some time to receive the first results since the DHT11 is relatively slow!
- DHT11:Temperature_RelativeHumidity.ino
#include "DHT.h" //loading DHT library
#define DHTPIN 2 //Connect module to Pin 2
#define DHTTYPE DHT11

DHT dht(DHTPIN, DHTTYPE);

void setup()
{
  Serial.begin(9600);
  dht.begin();
}

void loop()
{
  delay(2000); //Needs two seconds untill the module starts (needs time to load)
  float relative_humidity = dht.readHumidity();
  float temperature = dht.readTemperature();
  Serial.print("relative humidity: ");
  Serial.print(relative_humidity);
  Serial.println(" %");
  Serial.print("temperature: ");
  Serial.print(temperature);
  Serial.println(" °Celsius");
}
The given code is adapted from this tutorial.
The results of the measurements can be found in the “serial monitor”.
Measurement of Rainevents and Waterlevels
Meinert
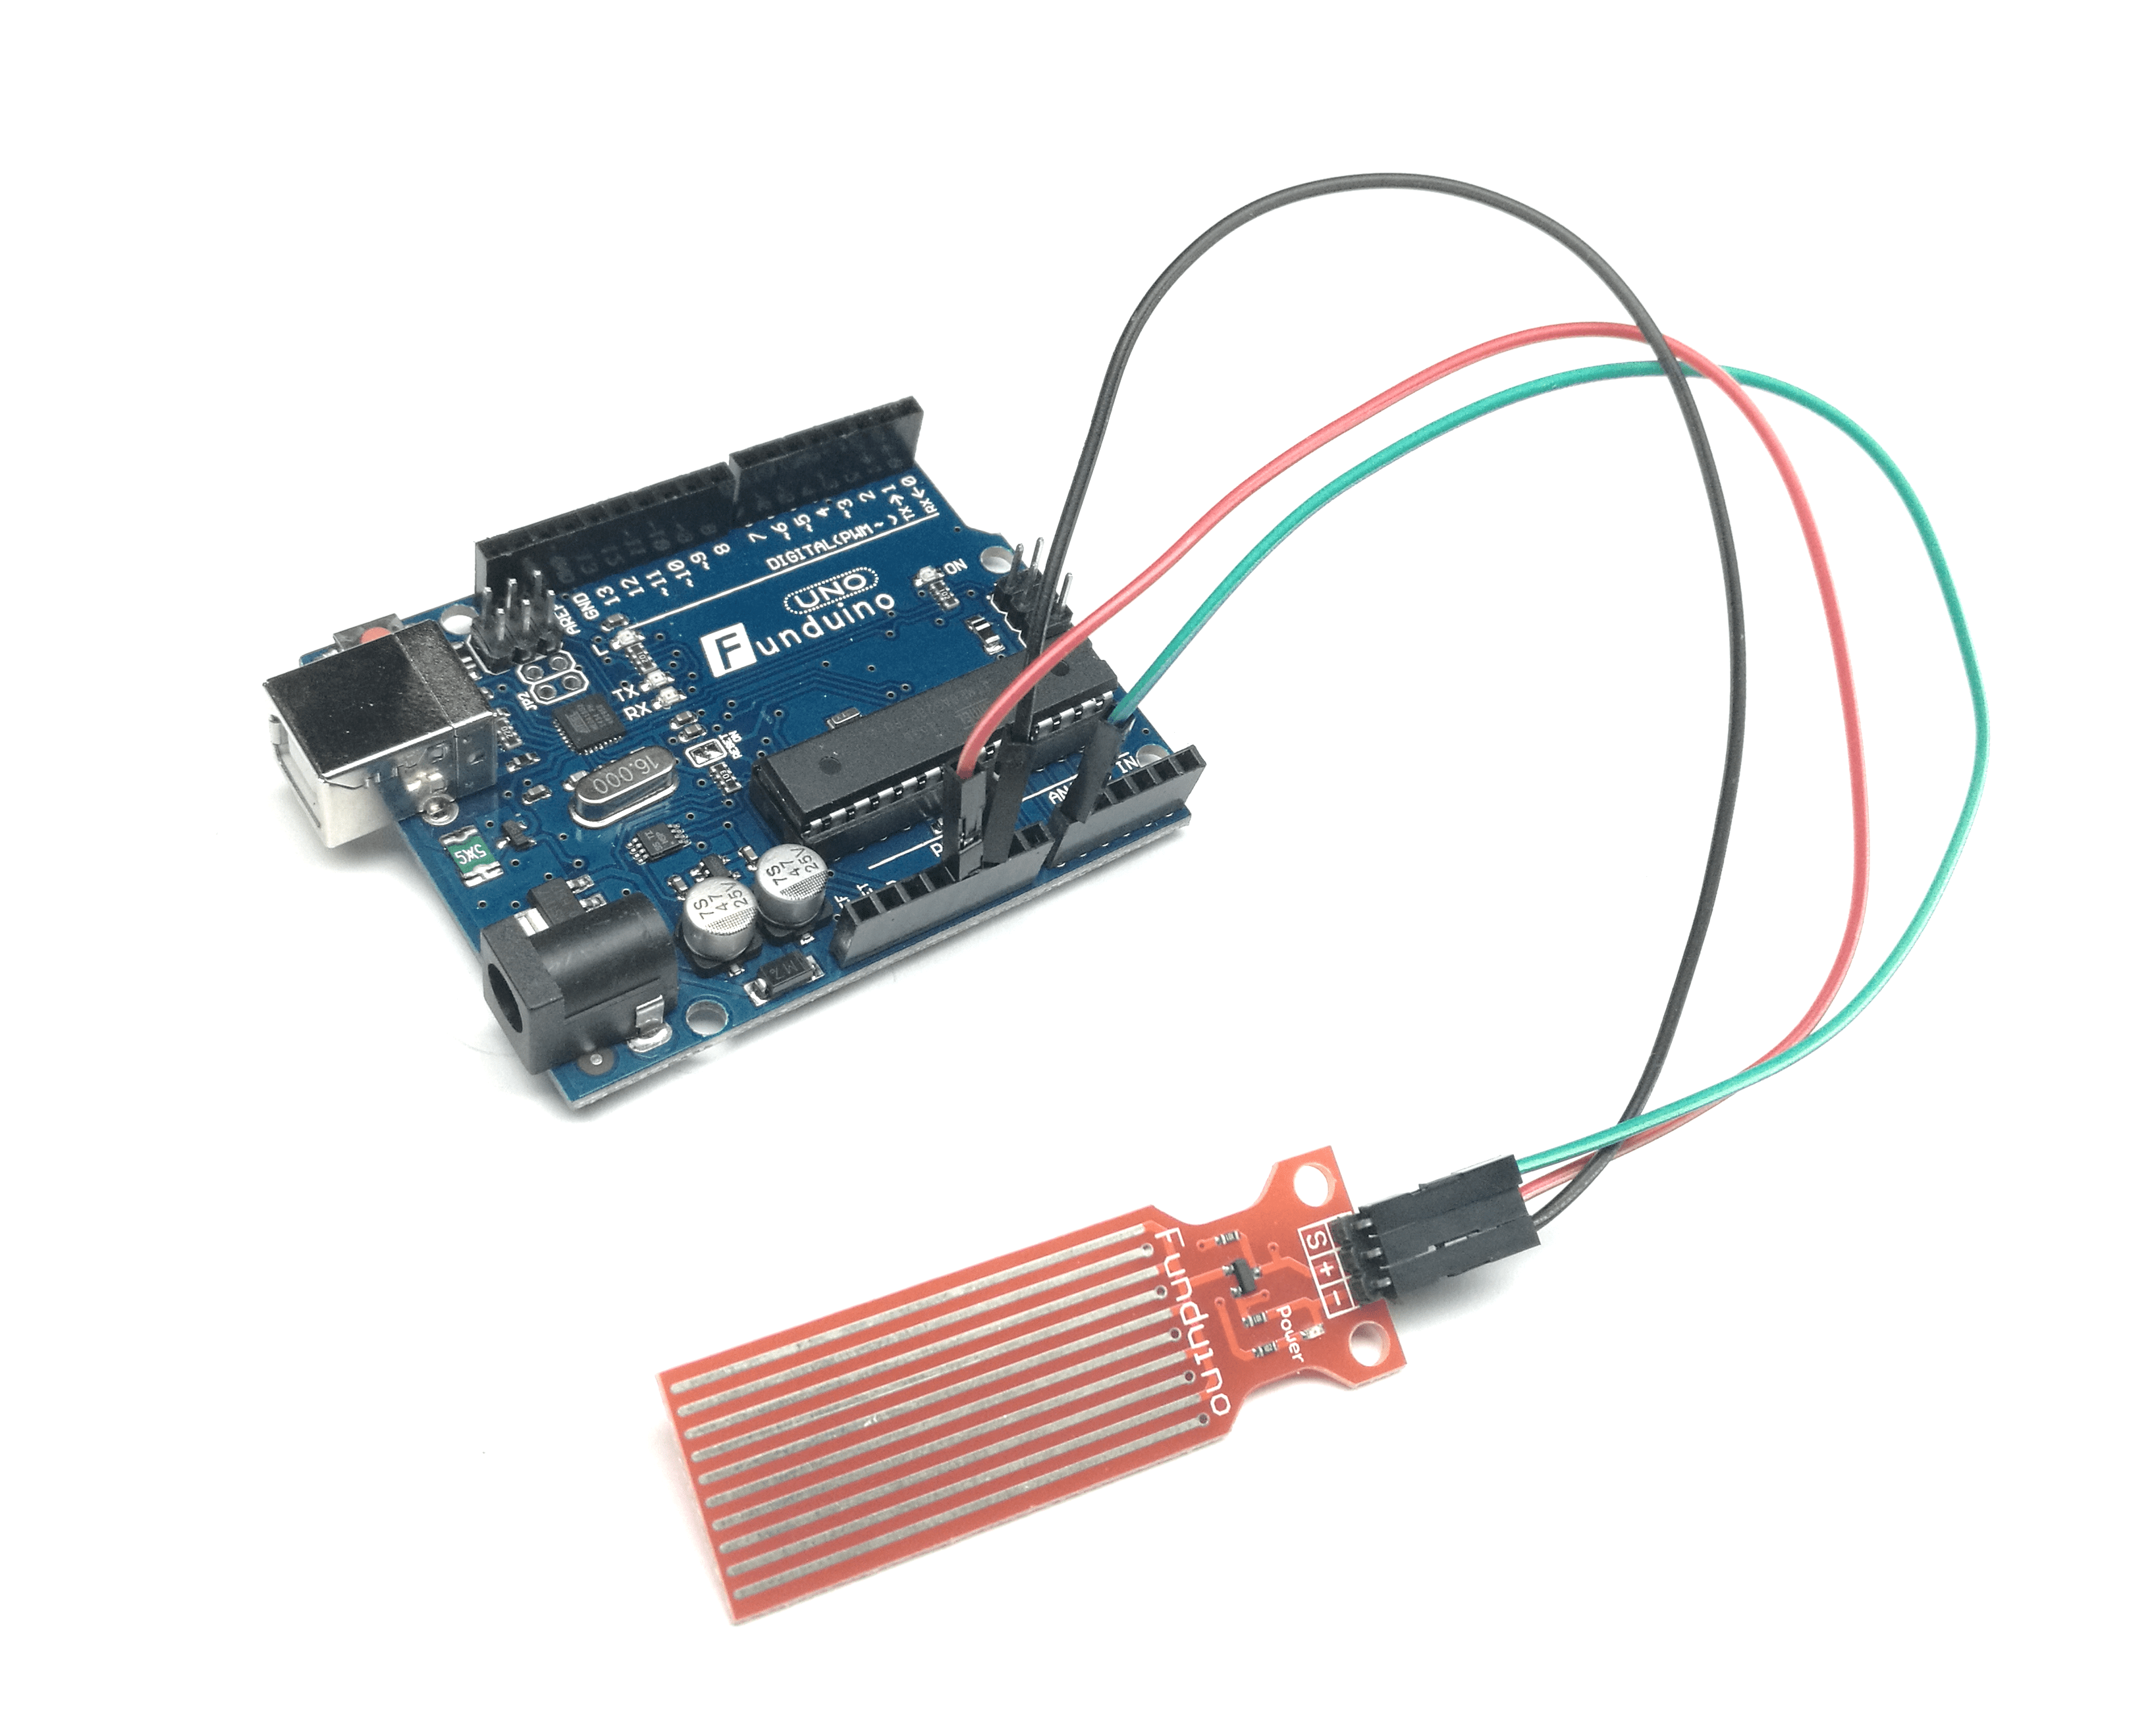
The Water Level Detection Sensor Module gives analog data about the availability of water that hits the sensor.
Where is it used for?
The sensor can be used to detect the water level in a tank or if it is raining.
By measurements in a tank it is important that the sensor is installed directly in the tank and at the level that should be observed. The parallel lines of the sensor must be perpendicular to the water. This can help for example farmers to see if their cattle need more fresh water in their trough. By doing it this way, the farmer can save time, water as well as the health of the cattle since more fresh water can be provided due to the circumstance that less bacteria can build up in the troughs.
If the sensor should be used as a rain detector, it has to be laid out in a horizontal position towards the rain. This is another use that may help farmers to know whether their fields have to be watered or if a rain event happened and if it was long enough. This would be more efficient for the farmer because it can save time, water and money.
Technical facts
The sensor works with a power supply of 3.3V to 5V and a current of <20mA. Its humidity sensitivity range lays between 10% and 90%. The output is given in analog values.
Since the sensor uses water as a conductor it is important to mention that salts are dissolved in the water. Under normal conditions, this is in every natural location the case. Only distilled water has as good as no dissolved particles inside. However, in this project the precipitation should be detected. Thus, this aspect is neglectable.
https://i0.wp.com/funduino.de/wp-content/uploads/2016/01/TA.png?resize=768%2C620&ssl=1
Limitations
A limitation by using the sensor in tanks is that the sensors are relatively short with an effective length of 4cm. If a larger level should be observed, more of those sensors are necessary.
Another aspect is that if the rain should be measured, the drops stay on the sensor until they are evaporated. Thus, it can be assumed that the rain event is much shorter than indicated, especially at foggy and cold weather. Then the evaporation rate is low, and it takes some time until the water is evaporated, especially if it is built up in areas sheltered from winds. The sensor cannot differentiate if a raindrop has fallen shortly before on it or if the drop is there already since the last measurement. An experiment was done to show this limitation more detailed. This is explained furthermore after the code is explained.
Another issue is that the sensor needs time until it recognizes the first drops. In another experimental setup, the sensor needed 27 minutes to give a result that shows values. In the following picture it gets cleat that the drops were even visible by looking at the sensor.
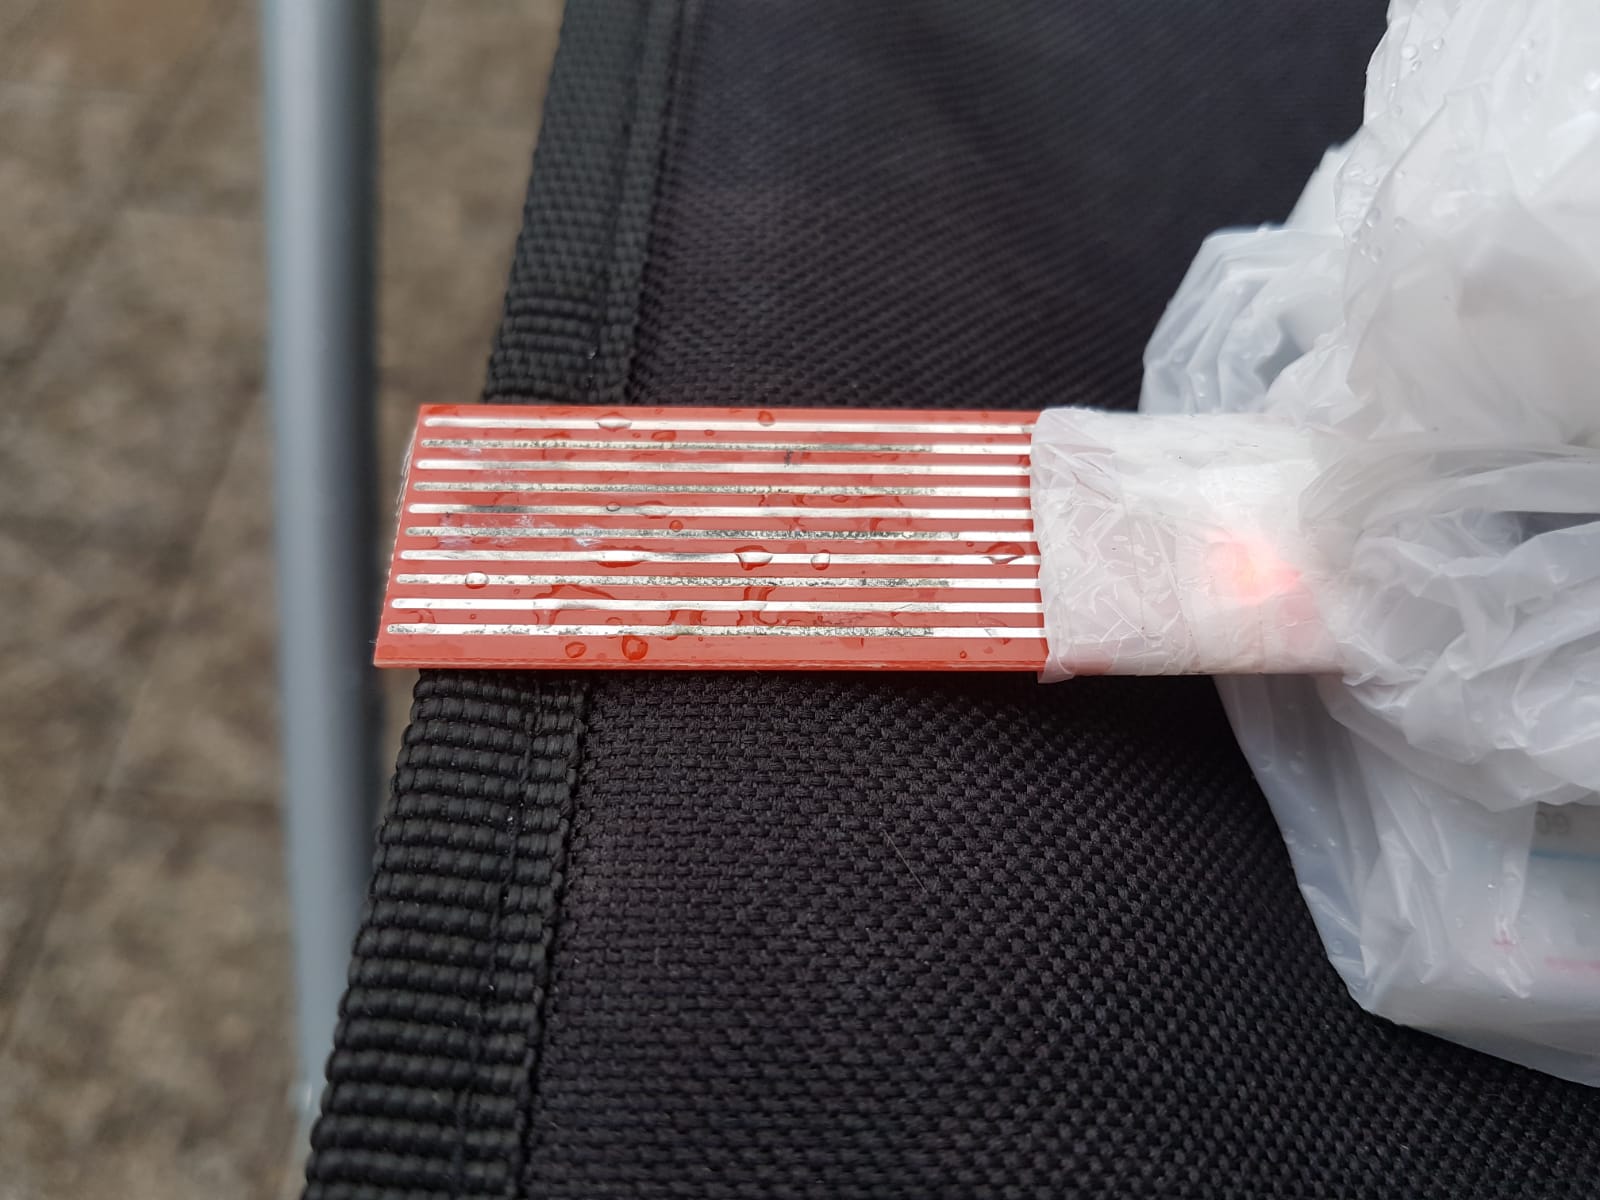
Sensor during a rain event with result “0mm - No precipitation”, picture: Vanessa Meinert
How to use the Water Level Detection Sensor Module
The programming of the module is relatively easy and can be seen in the part “Technical facts”. More information can be found in the code below, where the +Port is connected to 5V, the -Port to GND and the S-Port to A0.
- WaterLevelDetectionSensorModule_FirstCode.ino
int values=0; //Store variable under "values"

void setup()
{
  Serial.begin(9600);
}

void loop()
{
 values=analogRead(A0); //Connect to analog Pin A0
  Serial.print("Moisture-Value:");
  Serial.println(values);
  delay(5000);
}
The code was written with the help of this tutorial.
The analog values are in a range between 0 and 710 and can be observed in the serial monitor. The higher the outcome, the higher is the water level. The analog values can be changed into millimetres so that they can directly be used.
| Height of water | Output values |
|---|---|
| 0mm | 480 |
| 5mm | 530 |
| 10mm | 615 |
| 15mm | 660 |
| 20mm | 680 |
| 25mm | 690 |
| 30mm | 700 |
| 35mm | 105 |
| 40mm | 710 |
To change the analog data into a unit of height, another code is needed.
- WaterLevelDetectionSensorModule_SecondCode.ino
const int read = A0; //Analog pin A0
int value;

void setup()
{
  Serial.begin(9600);
}

void loop()
{
  value = analogRead(read); //Read data from analog pin and store it to value variable

  if (value<=480){ //Use "if" and "if else" clauses to change data into millimeters
    Serial.println("Water level: 0mm - Empty!");
  }
  else if (value>480 && value<=530){
    Serial.println("Water level: 0mm to 5mm");
  }
  else if (value>530 && value<=615){
    Serial.println("Water level: 5mm to 10mm");
  }
  else if (value>615 && value<=660){
    Serial.println("Water level: 10mm to 15mm");
  }
  else if (value>660 && value<=680){
    Serial.println("Water level: 15mm to 20mm");
  }
  else if (value>680 && value<=690){
    Serial.println("Water level: 20mm to 25mm");
  }
  else if (value>690 && value<=700){
    Serial.println("Water level: 25mm to 30mm");
  }
  else if (value>700 && value<=705){
    Serial.println("Water level: 30mm to 35mm");
  }
  else if (value>705){
    Serial.println("Water level: 35mm to 40mm");
  }

  delay(5000); // Check for new value every 5 sec
}
The values and the second code lean on this tutorial.
Through this change, the water height in a rain gauge can be measured easily.
Additionally, the amount of precipitation can be measured more easily since 1mm is equal to 1l/m².
How the sensor behaves after a rainfall
The water level on the sensor was measured after a rain event. In addition to that, the temperature and relative humidity were measured to see how the values change after a rain event stops. All three values were measured every second to detect anomalies since some may occur.
The time intervals were divided every time, the water level changes. The temperature and relative humidity values in those intervals were given as minimum and maximum values.
| time in intervals according to water levels | water level | temperature | relative humidity |
|---|---|---|---|
| Moment when rain event stops | 25mm to 30mm | 29.80°C | 54.00% |
| Between the 2nd and 27th minute | 5mm to 10mm | 29.90°C to 31.10°C | 54.00% to 47.00% |
| In the 28th minute | 20mm to 25mm | 29.10°C | 53.00% |
| Between the 29th and 31th minute | 15mm to 20mm | 29.70°C to 30.10°C | 52.00% to 50.00% |
| Between the 30th and 70th minute | 10mm to 15mm | 29,80°C to 32.40°C | 50.00% to 41.00% |
| Between the 71th and 73th minute | 5mm to 10mm | 31.70°C to 32.30°C | 40.00% to 42.00% |
| Between the 74th and 75th minute | 0mm to 5mm | 31.40% to 31.70°C | 43.00% |
| After the 75th minute | 0mm - No precipitation or moisture | 31.60°C | 43.00% |
It gets obvious that the sensor shows values for a water level for 75 minutes after the rain event stops completely. This demonstrates that the sensor is not able to differentiate between remaining water on the sensor or new drops of water. This can lead to misinterpretations of the duration and intensity of a rain event.
It has to be mentioned that the day the measurements were taken, the temperatures were very high directly after the rain event and were taken in shade. The high temperatures should normally increase the evaporation on the sensor. It can be assumed that under lower temperature conditions, the sensor will show precipitation values for even longer times. This would eventually be also true if the relative humidity is higher since the atmosphere is already more saturated with water vapour.
By looking at the numbers in the table it gets obvious that the water level increases in the 28th minute even if no rain felt. This is rather unusual but possible. A reason could be that the drops on the sensor formed one big drop that was wider but not as high as the small drops. This can lead to a different distribution of the water on the sensor.
After that moment in time, no other anomalies were recorded and the water level decreases in uneven time intervals.
After the rain event, the temperature increases and the relative humidity decreases over time.
Luminosity measurement
Klanten
- 10K Ω Resistor

https://www.circuitspedia.com/ldr-sensor-circuit/
Where is it used for?
A light dependent resistor (LDR) or photoresistor is a simple device, which can be used to sense the presence or absence of light. The resistance is dependent on the light intensity, the higher the light intensity, the lower the resistance. Applications include for example automatic light control for streetlights and alarm clocks, as well as smoke detection.
Technical facts
An LDR has no polarity and can be connected in any direction. It is a 5 V device. The cell resistance is varying from 400 Ω at 1000 lux up to 9 kΩ at 10 lux. Therefore a 10 kΩ Resistor is used.
According to the data sheet, the spectral response is best between 520 and 580 nm, which is in the range of green and yellow light.
Limitations
The output data of the device are not given in a unit for illuminance. Without another light sensor providing data for comparison, it is not possible to calibrate the device to provide exact illuminance data. However, it is possible to compare the provided data with the current light conditions and calibrate the device accordingly. This does not result in exact measurements, but only gives a rough description of the given light conditions. For further information, see “Calibration” below.
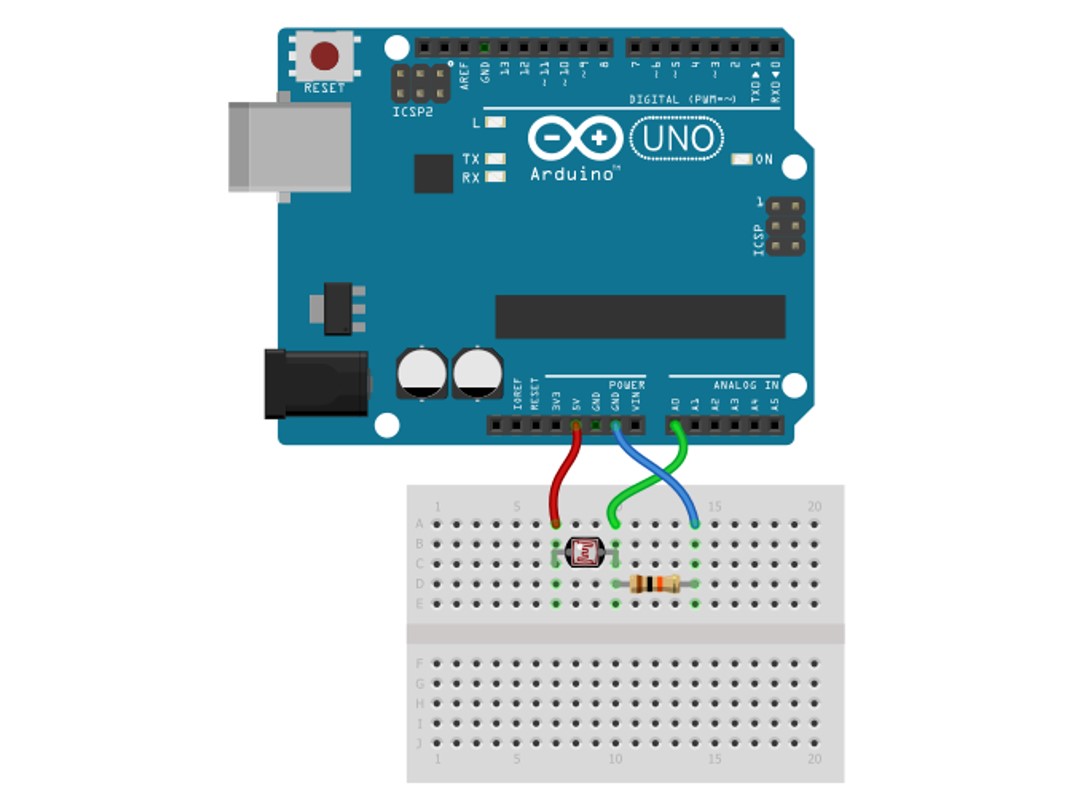
How to use the LDR
Connect the LDR and the resistor as indicated in the scheme below. The photoresistor is connected to 5 V and to the 10 kΩ Resistor, which is connected to ground. The input pin chosen here is A0.
https://create.arduino.cc/projecthub/sumanbargavr/working-with-light-dependent-resistor-ldr-1ded4f
Use a simple code to read the first values with the serial monitor. The code is an adaption from the code used here.
- AnalogReadSerial.ino
const int ldr = A0; //define input pin

void setup() {
  Serial.begin(9600); //serial monitor
}
void loop() {
  Serial.println(analogRead(ldr)); //print data
  delay(1000);
}
Calibration
An experimental set up was used to draw meaning from the read data, varying from 0 to 1024. This is the usual resolution of an analogue pin, a 10-bit resolution, which is translated into values in the mentioned range. The values were read at different light conditions to be able to assign them.
| light conditions | corresponding value | |
|---|---|---|
| Outside | sunny day | 5 |
| sunny day between crops | 50 | |
| cloudy day | 46-86 | |
| rain | 74-135 | |
| dusk/dawn | 202-900 | |
| Inside | illumination | 150-400 |
| no illumination | 500-570 | |
| darkness | 1024 |
There is a lot of variation dependant on whether the light source is artificial or natural. The variations for different weather conditions outside is much lower. Since the device is planned for outdoor application, the according data set is used for calibration. This calibration leads to misleading results if the device is used for artificial light sources and is therefore only appropriate for outdoor use.
The experimental data are translated into number ranges, which are assigned to different weather conditions. The used code is adapted, to provide a meaningful output.
- AnalogReadSerial.ino
const int ldr = A0;

void setup() {
  Serial.begin(9600);
  pinMode(ldr,INPUT);
}

void loop() {
  int ldrStatus=analogRead(ldr);
  Serial.print("Light conditions: ");
// assign data to light conditions by using an if...else structure
if (ldrStatus <= 50) {
  Serial.println("sunny day");
}
else if ((ldrStatus > 50) && (ldrStatus  <= 85)) {
  Serial.println("cloudy day ");
}
else if ((ldrStatus > 85) && (ldrStatus  <= 135)) {
  Serial.println("rain probability ");
}
else if ((ldrStatus > 135) && (ldrStatus  <= 900)) {
  Serial.println("dusk or dawn");
}
else {
  Serial.println("darkness");
}
  delay(1000);
}
An if... else structure is used to assign data ranges to weather conditions. Other used variables and structures can be found here.
Soil Moisture
Klanten
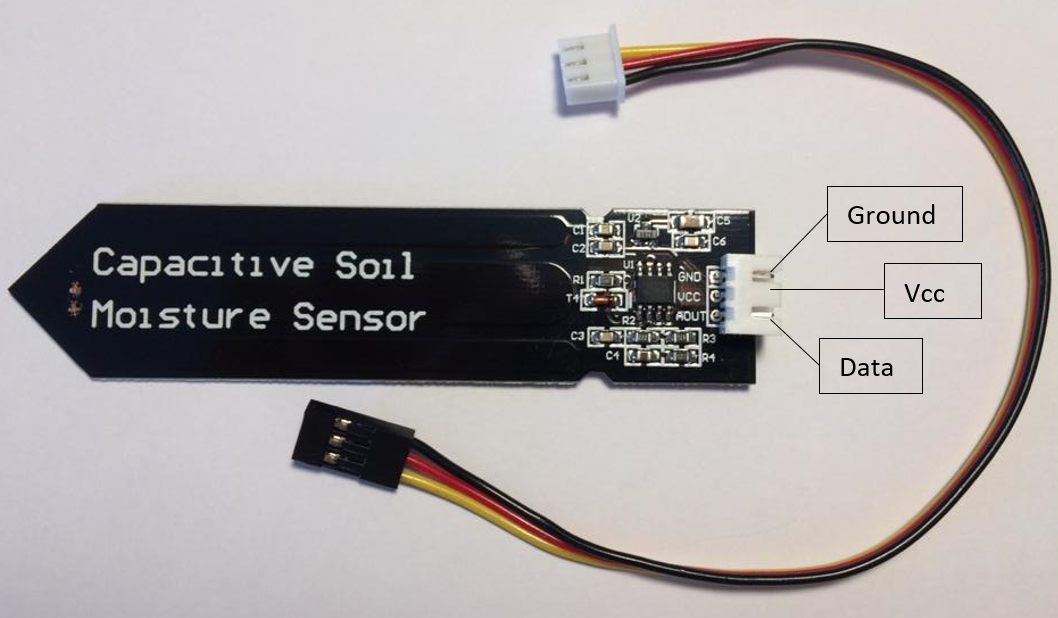
Picture: Marie Christine Klanten
Where is it used for?
This device is used for soil moisture detection in gardening or agriculture. As the name already indicates, a capacitive soil moisture sensor works like a capacitor. The charging and discharging over time are measured. The time measured changes in presence or absence of moisture, since the capacity is dependent on the amount of water present.
Another options would be a moisture module, which measures soil moisture by measuring the resistance between 2 pins, since water also changes the resistance. But these measurement devices are vulnerable to corrosion and therefore not suitable for long term applications. Another problem is that fertilizer also changes the resistance, which makes a capacitive soil moisture sensor the better choice for field applications.
Technical facts
This device is an analogue output device, operating at 3.3V to 5V. It supports a 3-pin sensor interface and is suitable for Arduino. More information can be found on the data sheet.
Limitations
The device has only an effective length of 7 cm and therefore can only assess the moisture of the upper most layer of the soil. Conclusions about the water content in deeper soil layers are difficult, which makes the device unsuitable for plants with deep roots.
How to use the Capacitive Soil Moisture Sensor
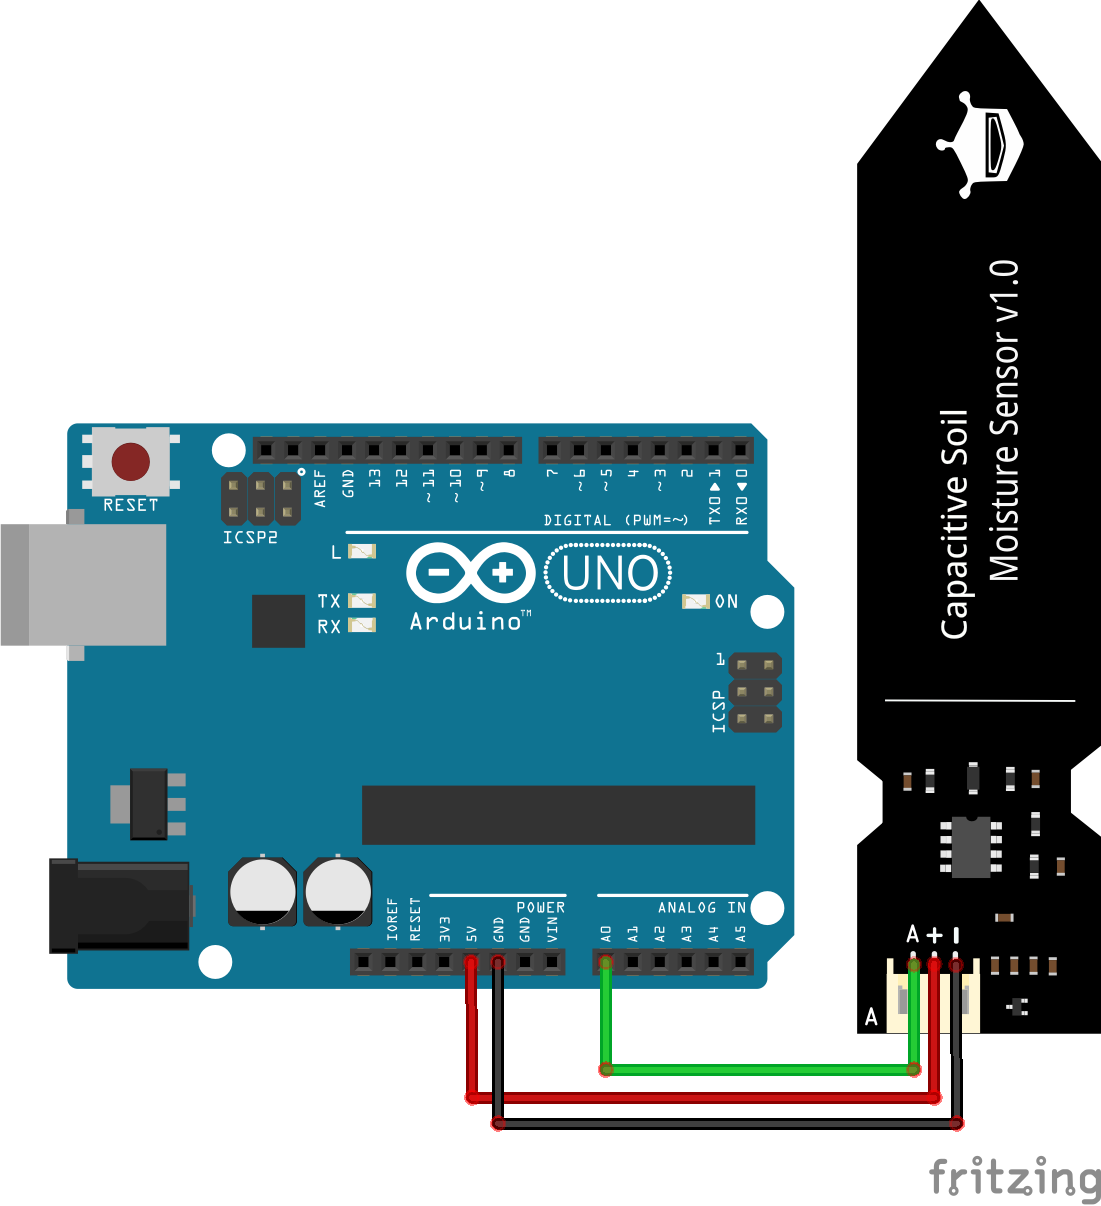
Connect the sensor to 5V and ground as indicated in the scheme below. The input pin A5 is chosen in this case.
https://arduino-tutorials.net/tutorial/capacitive-soil-moisture-sensor-arduino
Use a simple code to read data from the sensor.
- AnalogReadSerial.ino
const int humid = A5; //define input pin

void setup() {
  Serial.begin(9600); //serial monitor
}

void loop() {
 Serial.println(analogRead(humid)); //print data
 delay(1000);
}
Calibration
Measurements show a value of 585 for dry conditions, and a value of 298
for wet conditions, where the sensor is placed in a glass of water. The aim is, to transform the sensor range from 298- 585 into a meaningful scale from 0-100% soil moisture.
- AnalogReadSerial.ino
const int humid = A5;
const int dry=585; //value for dry conditions
const int wet=298; //value for wet conditions

void setup() {
  Serial.begin(9600);
}
void loop() {
  int sensorVal=analogRead(humid);
  int percHumidity=map(sensorVal, wet, dry, 100,0);
//transform sensor range in a % soil humidity scale
//careful: 298=100%, 585=0%

  Serial.print(percHumidity);
  Serial.println("%");

 delay(1000);
}
The measured values are indicating the upper and lower limits. They are defined as constants for wet and dry conditions, where 298=100% and 585=0% soil humidity. Using the Arduino map-function the sensor range is then transferred into a % soil moisture scale.
The sensor is now providing the desired data.
Combined Code
Schematic

Schematic of the connection of the sensors to the Arduino board by Veronika Skwirut
Code
Klanten
The codes explained above are combined in a single file to read all measurement data at a time.
Careful: The serial monitor is now set to an upload speed of 115200.
- AnalogReadSerial.ino
//include libraries required for the DHT sensor, define digital input pin and used DHT sensor type
#include <DHT.h>
#define DHTPIN 2
#define DHTTYPE DHT11

DHT dht(DHTPIN, DHTTYPE);

//Define analogue input pins
const int ldr = A0;
const int precip = A2;
const int moist = A5;

//define constants for soil moisture
const int dry=585;
const int wet=298;

void setup() {
  Serial.begin(115200); //start serial monitor
  dht.begin();
}

void loop() {
//read and print Temperature and Humidity from DHT, no calibration necessary
  float humidity = dht.readHumidity();
  float temperature = dht.readTemperature();
  Serial.print("Relative humidity: ");
  Serial.print(humidity);
  Serial.println(" %");
  Serial.print("Temperature: ");
  Serial.print(temperature);
  Serial.println(" °Celsius");

//read analogue input pins and convert data into meaningful output
//(for details: https://wiki.eolab.de/doku.php?id=amc2020:group_f:start&do=)

  int ldrStatus=analogRead(ldr);
  int sensorVal=analogRead(moist);
  int value = analogRead(precip);
  int percHumidity=map(sensorVal, wet, dry, 100,0);
  Serial.print("Light conditions: ");
if (ldrStatus <= 50) {
  Serial.println("sunny day");
}
else if ((ldrStatus > 50) && (ldrStatus  <= 85)) {
  Serial.println("cloudy day ");
}
else if ((ldrStatus > 85) && (ldrStatus  <= 135)) {
  Serial.println("rain probability ");
}
else if ((ldrStatus > 135) && (ldrStatus  <= 900)) {
  Serial.println("dusk or dawn");
}
else {
  Serial.println("darkness");
}
  Serial.print("Precipitation: ");
  if (value<=480){
    Serial.println("Water level: 0mm - Empty!");
  }
  else if (value>480 && value<=530){
    Serial.println("Water level: 0mm to 5mm");
  }
  else if (value>530 && value<=615){
    Serial.println("Water level: 5mm to 10mm");
  }
  else if (value>615 && value<=660){
    Serial.println("Water level: 10mm to 15mm");
  }
  else if (value>660 && value<=680){
    Serial.println("Water level: 15mm to 20mm");
  }
  else if (value>680 && value<=690){
    Serial.println("Water level: 20mm to 25mm");
  }
  else if (value>690 && value<=700){
    Serial.println("Water level: 25mm to 30mm");
  }
  else if (value>700 && value<=705){
    Serial.println("Water level: 30mm to 35mm");
  }
  else if (value>705){
    Serial.println("Water level: 35mm to 40mm");
  }
  //print data
  Serial.print("Soil moisture: ");
  Serial.print(percHumidity);
  Serial.println("%");
  Serial.println();
  delay(2000);

}
Results
The readings of the different sensors can be accessed via serial monitor. This is a possible, but not very useful solutions since the data need to be read manually.
Attempt 2: ESP 32
Klanten
Transfer Data to a web server
We decided to improve our idea by adding the option to transfer data via Wi-Fi. The Arduino Uno is a small but powerful microcontroller. However, it comes with a huge disadvantage. To be able to read the measured data, you have to use an installed display or the serial monitor. This means you have to go to the measuring station, to check the data manually. To avoid that, we decided to use an ESP 32. This small device is able to read the data and upload them via Wi-Fi to a web server. Therefore, the conditions within the field can be checked from any location, if the ESP32 local IP address is known.
Material and Methods

https://www.soselectronic.de/products/espressif/esp32-devkitc-ver-d-305403
- Photoresistor + 10K Ω Resistor
- Power supply module +9V Battery with snap on connector clip
- Jumper Wires
Schematic
The sensors are connected to ground and 5V accordingly, as well as the different input-pins like indicated below. Further information regarding the sensors can be found above.

Schematic of the connection of the sensors to the ESP32 board by Veronika Skwirut
Install the Board
Meinert, Text: Klanten
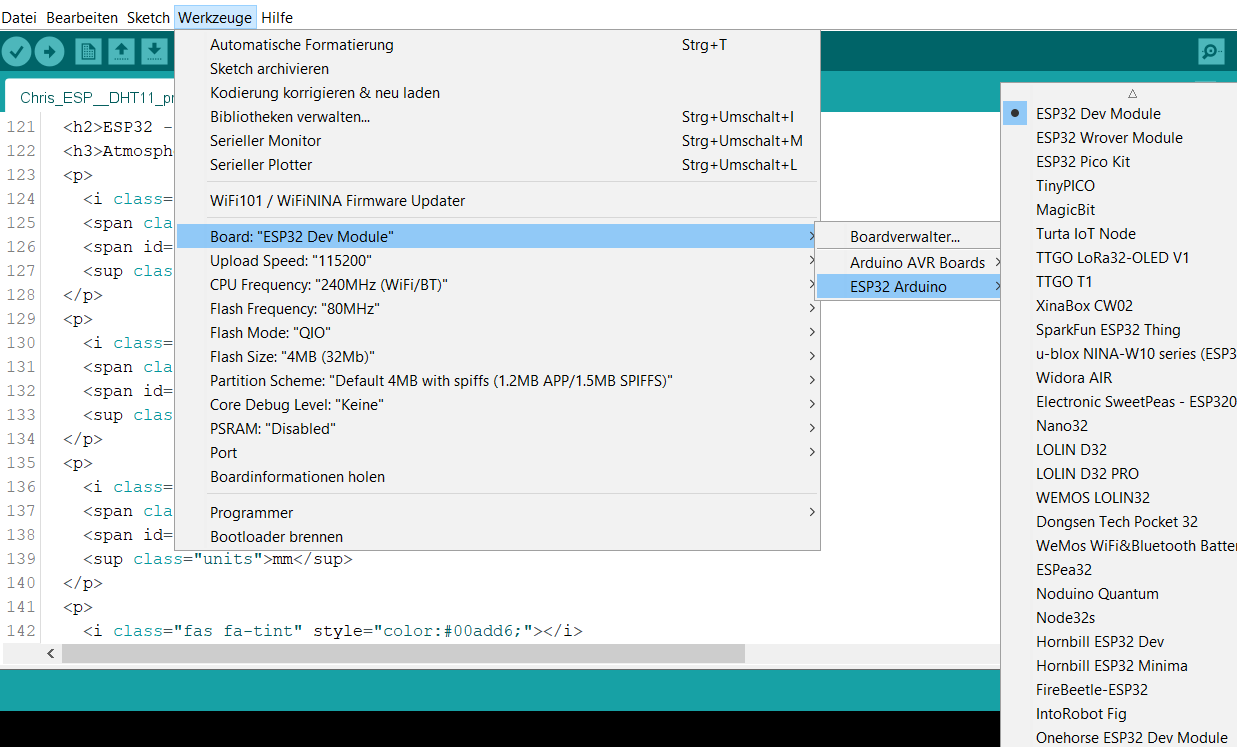
We use the Arduino IDE to program the ESP32. To be able to do so, the ESP32 Board has to be installed in the Arduino IDE first. Information how this is done can be found here.
Chose the right ESP32 board, 'ESP 32 Dev Module' in our case
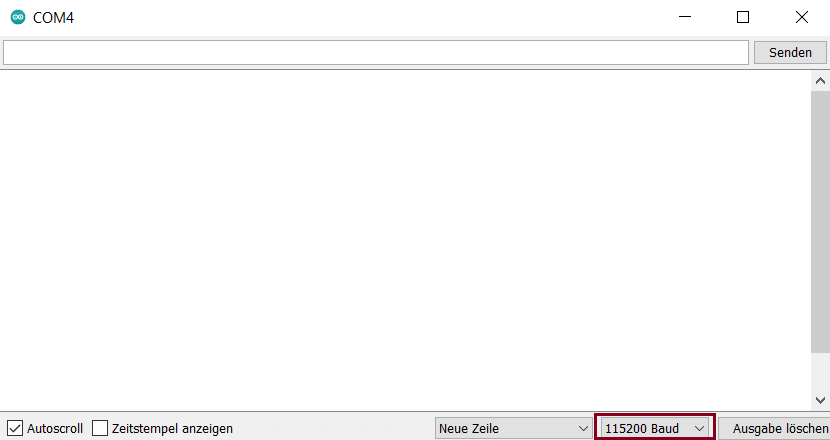
Do not forget to set your upload speed to 115200 and your serial Port to COM 4.

Install Libraries
Klanten
Before getting started with this project, it is necessary to install some libraries, if they are not already installed.
Required libraries for the DHT sensor are:
- 'DHT sensor driver library'
- 'Adafruit Unified Sensor Driver library'
Additionally, two libraries to build the asynchronous web server:
- 'ESPAsyncWebServer libary'
- 'Async TCP library'
Information about the installation can be found here.
We used the code presented in this tutorial as a basis and modified it to create a more complex measurement station, which includes more sensors and measurements.
Code
Klanten, other attempts: Skwirut (not shown here)
- AnalogReadSerial.ino
/********* Code based on: Rui Santos Complete project details at https://randomnerdtutorials.com Modified by Marie Christine Klanten Details on https://wiki.eolab.de/doku.php?id=amc2020:group_f:start&do= *********/ // Import required libraries #include "WiFi.h" #include "ESPAsyncWebServer.h" #include <Adafruit_Sensor.h> #include <DHT.h> // Replace with your network credentials const char* ssid = "your SSID"; const char* password = "your password"; #define DHTPIN 27 // Digital pin connected to the DHT sensor #define DHTTYPE DHT11 // type of sensor used DHT dht(DHTPIN, DHTTYPE); //define input pins const int waterLevelAnalogInPin = 33; const int lightAnalogInPin = 25; const int moistureAnalogInPin = 35; // Create asynchronous webserver object on port 80 AsyncWebServer server(80); //Read Data //Readings take a while, it is a slow sensor String readDHTTemperature() { // Temperature given by default in °C float t = dht.readTemperature(); // Check if any readings failed and exit early to try again if (isnan(t)) { Serial.println("Failed to read from DHT sensor!"); return "--"; } else { Serial.println(t); return String(t); } } String readDHTHumidity() { float h = dht.readHumidity(); if (isnan(h)) { Serial.println("Failed to read from DHT sensor!"); return "--"; } else { Serial.println(h); return String(h); } } String readSoilMoisture() { float s = analogRead(moistureAnalogInPin ); float Moisture = map(s, 1680, 3519, 100, 0); //map values to soil moisture % Serial.println(Moisture); return String(Moisture); } String readWaterLevel() { float w = analogRead(waterLevelAnalogInPin); if (w<=2700){ //if... else structure used to calibrate readings to avoid deviations due to the irregular slope Serial.println(0); return String(0); } else if (w>2700 && w<=2870){ Serial.println(5); return String(5); } else if (w>2870 && w<=2930){ Serial.println(10); return String(10); } else if (w>2930 && w<=3020){ Serial.println(15); return String(15); } else if (w>3020 && w<=3100){ Serial.println(20); return String(20); } else if (w>3100 && w<=3210){ Serial.println(25); return String(25); } else if (w>3210 && w<=3350){ Serial.println(30); return String(30); } else if (w>3350 && w<=3420){ Serial.println(35); return String(35); } else if (w>3420){ Serial.println(40); return String(40); } } String readLuminosity() { float l = analogRead(lightAnalogInPin); float Lum = map(l, 501, 4095, 0, 30000); //calibrate to get lux (30.000 lux for bright sunlight, 0 for darkness) Serial.println(Lum); return String(Lum); } //Building a web page const char index_html[] PROGMEM = R"rawliteral( <!DOCTYPE HTML><html> <head> <meta name="viewport" content="width=device-width, initial-scale=1"> <link rel="stylesheet" href="https://use.fontawesome.com/releases/v5.7.2/css/all.css" integrity="sha384-fnmOCqbTlWIlj8LyTjo7mOUStjsKC4pOpQbqyi7RrhN7udi9RwhKkMHpvLbHG9Sr" crossorigin="anonymous"> <style> html { font-family: Arial; display: inline-block; margin: 0px auto; text-align: center; } h2 { font-size: 3.0rem; } p { font-size: 3.0rem; } .units { font-size: 1.2rem; } .labels{ font-size: 1.5rem; vertical-align:middle; padding-bottom: 15px; } </style> </head> <body> <h2>ESP32 - meteorological measurement server</h2> <p> <i class="fas fa-sun" style="color:#ffff1a;"></i> <span class="labels">Luminosity</span> <span id="luminosity">%LUMINOSITY%</span> <sup class="units">lux</sup> </p> <p> <i class="fas fa-thermometer-half" style="color:#e69500;"></i> <span class="labels">Temperature</span> <span id="temperature">%TEMPERATURE%</span> <sup class="units">°C</sup> </p> <p> <i class="fas fa-tint" style="color:#005f6a;"></i> <span class="labels">Precipitation</span> <span id="waterlevel">%WATERLEVEL%</span> <sup class="units">mm</sup> </p> <p> <i class="fas fa-tint" style="color:#00add6;"></i> <span class="labels">Humidity</span> <span id="humidity">%HUMIDITY%</span> <sup class="units">%</sup> </p> <p> <i class="fas fa-globe-europe" style="color:#0c6b0b;"></i> <span class="labels">Soilmoisture</span> <span id="soilmoisture">%SOILMOISTURE%</span> <sup class="units">%</sup> </p> </body> //automatical updates <script> setInterval(function ( ) { var xhttp = new XMLHttpRequest(); xhttp.onreadystatechange = function() { if (this.readyState == 4 && this.status == 200) { document.getElementById("temperature").innerHTML = this.responseText; } }; xhttp.open("GET", "/temperature", true); xhttp.send(); }, 10000 ) ; setInterval(function ( ) { var xhttp = new XMLHttpRequest(); xhttp.onreadystatechange = function() { if (this.readyState == 4 && this.status == 200) { document.getElementById("humidity").innerHTML = this.responseText; } }; xhttp.open("GET", "/humidity", true); xhttp.send(); }, 10000 ) ; setInterval(function ( ) { var xhttp = new XMLHttpRequest(); xhttp.onreadystatechange = function() { if (this.readyState == 4 && this.status == 200) { document.getElementById("soilmoisture").innerHTML = this.responseText; } }; xhttp.open("GET", "/soilmoisture", true); xhttp.send(); }, 10000 ) ; setInterval(function ( ) { var xhttp = new XMLHttpRequest(); xhttp.onreadystatechange = function() { if (this.readyState == 4 && this.status == 200) { document.getElementById("waterlevel").innerHTML = this.responseText; } }; xhttp.open("GET", "/waterlevel", true); xhttp.send(); }, 10000 ) ; setInterval(function ( ) { var xhttp = new XMLHttpRequest(); xhttp.onreadystatechange = function() { if (this.readyState == 4 && this.status == 200) { document.getElementById("luminosity").innerHTML = this.responseText; } }; xhttp.open("GET", "/luminosity", true); xhttp.send(); }, 10000 ) ; </script> </html>)rawliteral" ; //assign placeholders String processor(const String& var) { if (var == "TEMPERATURE") { return readDHTTemperature(); } else if (var == "HUMIDITY") { return readDHTHumidity(); } else if (var == "SOILMOISTURE") { return readSoilMoisture(); } else if (var == "WATERLEVEL") { return readWaterLevel(); } else if (var == "LUMINOSITY") { return readLuminosity() ; } return String(); } void setup() { // Serial port for debugging purposes Serial.begin(115200); dht.begin(); // Connect to Wi-Fi WiFi.begin(ssid, password); while (WiFi.status() != WL_CONNECTED) { delay(1000); Serial.println("Connecting to WiFi.."); } // Print ESP32 Local IP Address Serial.println(WiFi.localIP()); // Route for web page server.on("/", HTTP_GET, [](AsyncWebServerRequest * request) { //store as index_html request->send_P(200, "text/html", index_html, processor); //replace placeholders }); // Start server server.begin(); } // asynchronous webserver- nothing in loop void loop() { }
How the Code works
Klanten
First steps
- Import the previously installed libraries to be able to create a webserver and read from the DHT sensor
- AnalogReadSerial.ino
#include "WiFi.h"
#include "ESPAsyncWebServer.h"
#include <Adafruit_Sensor.h>
#include <DHT.h>
- Insert your network credentials here
- AnalogReadSerial.ino
const char* ssid = "your SSID";
const char* password = "your password";
- Define the input pin used for the DHT sensor
- Define the type of sensor used. In our case it is a DHT11, but it can be changed to DHT22 or DHT21
- The last step is to define a DHT object with the previously defined pin and type
- AnalogReadSerial.ino
#define DHTPIN 27
#define DHTTYPE DHT11
DHT dht(DHTPIN, DHTTYPE);
- Define the input pins for the analogue sensors
- AnalogReadSerial.ino
const int waterLevelAnalogInPin = 33;
const int lightAnalogInPin = 25;
const int moist = 35;
- Create an asynchronous webserver object on port 80
- AnalogReadSerial.ino
AsyncWebServer server(80);
Start to read Data
Temperature and Humidity
- Read and store data from the DHT sensor by using
dht.readTemperature()anddht.readHumidity(), where the temperature in provided in °C, and the humidity in %, by default - It is a relatively slow sensor, so be patient
- Include a fail save by checking if reading data is possible, print an error message if not
- Store data and print them for possible debugging on the serial monitor
- The DHT data is provided in the right units, calibration of the sensor is not necessary
- Do the same for Humidity.
- AnalogReadSerial.ino
String readDHTTemperature() {
  float t = dht.readTemperature();
  if (isnan(t)) {
    Serial.println("Failed to read from DHT sensor!");
    return "--";
  }
  else {
    Serial.println(t);
    return String(t);
  }
}
- For the analogue sensors, calibration is necessary, to draw meaning from the data. The ESP32 provides data in 12-bit resolution. The output values vary from 0 to 4095. Since the Arduino provides 10-Bits, the previously used calibrations must be adapted.
Soil Moisture
- We read from the capacitive soil moisture sensor by using
analogRead() - In an experimental set up, values where measured at different conditions. 1680 corresponds to completely dry conditions, 3519 to completely wet conditions, in a glass of water
- Using these values and a map function, the soil moisture in % can be obtained
- The values are again stored and printed
- AnalogReadSerial.ino
String readSoilMoisture() {
  float s = analogRead(moist);
  float SoilMoisture = map(s, 1680, 3519, 100, 0);
  Serial.println(SoilMoisture);
  return String(SoilMoisture);
}
Luminosity
- The same is done for the LDR measurements
- Here the information provided in the LDR datasheet are used to map the output to luminosity in lux.
- A value of 501 corresponds to complete darkness (0 lux)
- 4095 corresponds to bright sunlight, which is about 30.000 lux, according to the LDR datasheet
- During calibration a lowered sensibility to light intensity was recognized. In contrary to the measured values with the arduino UNO board, the output data has a lowered variability. The upper limit of 4095 (30.000 lux) is reached not only in bright sunlight, but also in relatively dark conditions indoor. This leads to an adulteration of the measurements, but seems to be unavoidable when using the ESP32
- AnalogReadSerial.ino
String readLuminosity() {
  float l = analogRead(lightAnalogInPin);
  float luminosity = map(l, 501, 4095, 0, 30000);
  Serial.println(luminosity);
  return String(luminosity);
}
Precipitation
- Instead of a map function, an if... else structure is used to assign different water levels in mm to the output data
- This is done because the values do not change with constant slope, so a mapping function would lead to wrong results.
- The values corresponding to different water levels were recorded:
- Dry → 0
- 5mm → 2699
- 10mm → 2870
- 15mm → 2931
- 20mm → 3023
- 25mm → 3055
- 30mm → 3211
- 35mm → 3351
- 40mm → 3422
- Carefull: the sensor needs some time until the output is relatively constant and reliable.
- AnalogReadSerial.ino
String readWaterLevel() {
  float w = analogRead(waterLevelAnalogInPin);
  if (w <= 2700) { //if... else structure used to calibrate readings to avoid deviations due to the irregular slope
    Serial.println(0);
    return String(0);
  }
  else if (w > 2700 && w <= 2870) {
    Serial.println(5);
    return String(5);
  }
  else if (w > 2870 && w <= 2930) {
    Serial.println(10);
    return String(10);
  }
  else if (w > 2930 && w <= 3020) {
    Serial.println(15);
    return String(15);
  }
  else if (w > 3020 && w <= 3100) {
    Serial.println(20);
    return String(20);
  }
  else if (w > 3100 && w <= 3210) {
    Serial.println(25);
    return String(25);
  }
  else if (w > 3210 && w <= 3350) {
    Serial.println(30);
    return String(30);
  }
  else if (w > 3350 && w <= 3420) {
    Serial.println(35);
    return String(35);
  }
  else if (w > 3420) {
    Serial.println(40);
    return String(40);
  }
}
Start to create a web page
- With this code the web page is built and designed.
- Information about how to structure an html can be found here
- First, we define the type:
html - With
<meta>we make our web page available for different browsers - The
<link>is included to load icons from fontawesome. A variety of different symbols is available and can be easily used for your own web server by copying the provided HTML code. Check it out.
- AnalogReadSerial.ino
const char index_html[] PROGMEM = R"rawliteral(
<!DOCTYPE HTML><html>
<head>
  <meta name="viewport" content="width=device-width, initial-scale=1">
  <link rel="stylesheet" href="https://use.fontawesome.com/releases/v5.7.2/css/all.css" integrity="sha384-fnmOCqbTlWIlj8LyTjo7mOUStjsKC4pOpQbqyi7RrhN7udi9RwhKkMHpvLbHG9Sr" crossorigin="anonymous">
- The
<style>can be adapted. Things like text position and spacing, as well as font size and type are defined here.
- AnalogReadSerial.ino
  <style>
    html {
     font-family: Arial;
     display: inline-block;
     margin: 0px auto;
     text-align: center;
    }
    h2 { font-size: 3.0rem; }
    p { font-size: 3.0rem; }
    .units { font-size: 1.2rem; }
    .labels{
      font-size: 1.5rem;
      vertical-align:middle;
      padding-bottom: 15px;
    }
  </style>
</head>
- In the
<body>, the content of our webpage is defined. This includes headers<h>and paragraphs<p> - Here we define, how our sensor readings are printed. Label and unit, as well as a
>%PLACEHOLDER%<, which is later replaced by the measured values, are defined here - For visual effects, an icon and different colors are added. To change the color, the hexadecimal values of the desired colors must be used. These can be found here.
- AnalogReadSerial.ino
<body> <h2>ESP32 - meteorological measurement server</h2> <p> <i class="fas fa-sun" style="color:#ffff1a;"></i> <span class="labels">Luminosity</span> <span id="luminosity">%LUMINOSITY%</span> <sup class="units">lux</sup> </p> <p> <i class="fas fa-thermometer-half" style="color:#e69500;"></i> <span class="labels">Temperature</span> <span id="temperature">%TEMPERATURE%</span> <sup class="units">°C</sup> </p> <p> <i class="fas fa-tint" style="color:#005f6a;"></i> <span class="labels">Precipitation</span> <span id="waterlevel">%WATERLEVEL%</span> <sup class="units">mm</sup> </p> <p> <i class="fas fa-tint" style="color:#00add6;"></i> <span class="labels">Humidity</span> <span id="humidity">%HUMIDITY%</span> <sup class="units">%</sup> </p> <p> <i class="fas fa-globe-europe" style="color:#0c6b0b;"></i> <span class="labels">Soilmoisture</span> <span id="soilmoisture">%SOILMOISTURE%</span> <sup class="units">%</sup> </p> </body>
Updates
- Between
<script>we add code for automatic updates. - The
Interval(function ( )runs every 10 seconds. - An update is requested, and the received value is assigned to the element with the previously defined ID.
- The same is done for the other sensors.
- Afterwards the section with html code is closed.
- AnalogReadSerial.ino
<script>
setInterval(function ( ) {
  var xhttp = new XMLHttpRequest();
  xhttp.onreadystatechange = function() {
    if (this.readyState == 4 && this.status == 200) {
      document.getElementById("temperature").innerHTML = this.responseText;
    }
  };
  xhttp.open("GET", "/temperature", true);
  xhttp.send();
}, 10000 ) ;
</script>
</html>)rawliteral";
- The
processorfunction is responsible for replacing the previously set placeholders, by the measured data. - Dependent on the placeholder, the different readings are assigned.
- This is again done for all sensors
- AnalogReadSerial.ino
String processor(const String& var) {
  if (var == "TEMPERATURE") {
    return readDHTTemperature();
  }
  return String();
}
Final Settings
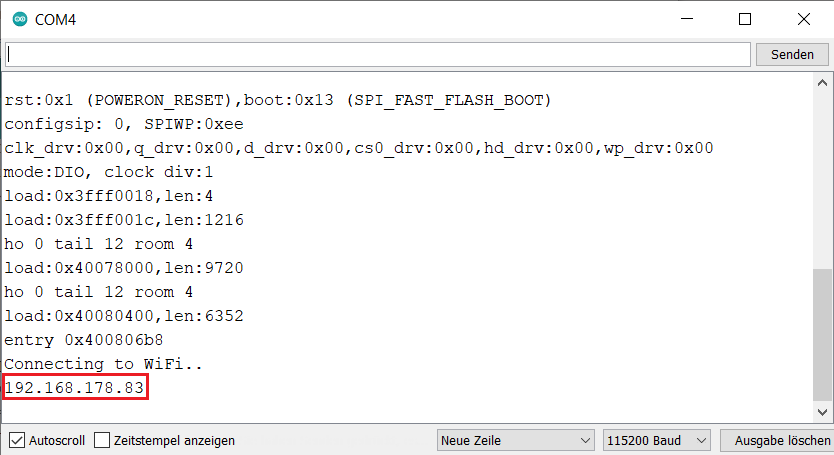
- As already mentioned, the serial monitor is started. This can be used for debugging, in case any problems with the web server occur. Additionally it is required to read the local IP address of the ESP32.
- DHT reading is also started here
- AnalogReadSerial.ino
void setup() {
  Serial.begin(115200);
  dht.begin();
- Start to connect the ESP 32 to your Wi-Fi.
- Attention: The range of the ESP32 to is lower than the range of usual smartphones or computers. You might have to get closer to the router to get a connection.
- The local IP address of the ESP 32 is printed, which is required to reach the web server.
- AnalogReadSerial.ino
  WiFi.begin(ssid, password);
  while (WiFi.status() != WL_CONNECTED) {
    delay(1000);
    Serial.println("Connecting to WiFi..");
  }
  Serial.println(WiFi.localIP());
- Route for the web page and send the content stored as
index_html - The
processorfunction is responsible for the replacement of the correct values
- AnalogReadSerial.ino
  server.on("/", HTTP_GET, [](AsyncWebServerRequest * request) {
    request->send_P(200, "text/html", index_html, processor);
  });
- Now we can finally start our server
- AnalogReadSerial.ino
  server.begin();
}
- Since it is an asynchronous web server, there is nothing to loop
- AnalogReadSerial.ino
void loop() {
}
Upload the Code
Upload your code to the ESP32. It can take a while. Use the RTS pin to restart the device and open the serial monitor. If a Wi-Fi connection is found, you can copy the IP address to access the server.
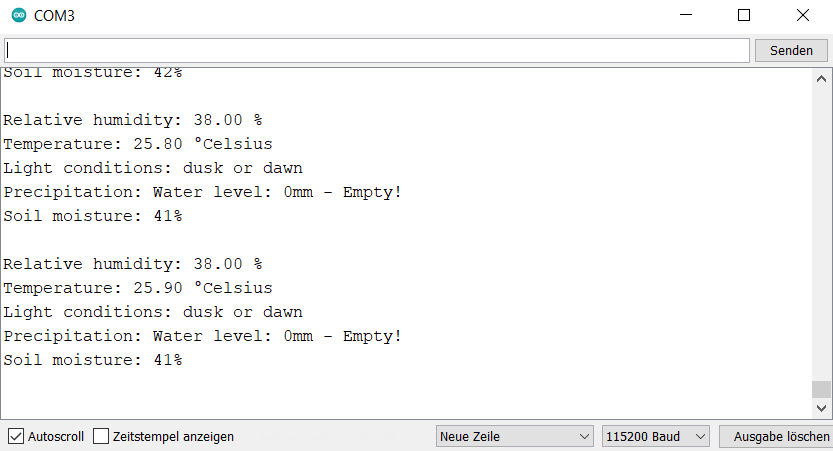
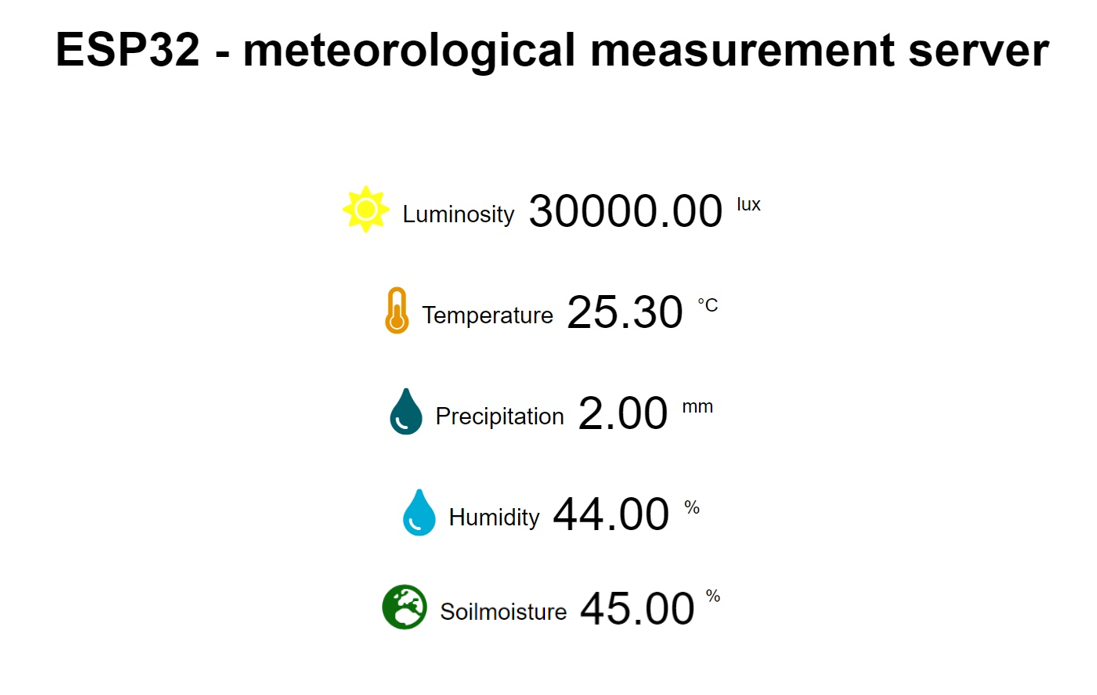
Results
The server can be accessed from any place, as long as the IP address is known, and the ESP 32 has an active Wi-Fi connection. Thus, constant monitoring without approaching the vicinity is no problem anymore.
Measurements at different locations
Meinert
To show the importance of a portable weather station, measurements at different locations are done. This is done by measuring the temperature, relative humidity, light conditions, precipitation and soil moisture in two gardens, in a forest, on a field, a parking lot and in a park. The experiments were done with the Arduino UNO since no Wi-Fi was available in all locations. The relults can be found in the following table.
| location | information about location | temperature | rel. humidity | light conditions | precipitation | soil moisture |
|---|---|---|---|---|---|---|
| Garden (1) | Garden in an urban area in Kamp-Lintfort, soil is very compacted, hard and watered daily | 30.10° Celsius | 51.00% | dusk or dawn | 0mm - No rain | 58% |
| Garden (2) | Garden in a smaller town (Repelen) near a cemetry, the environmental surrounding is more natural than in “Garden (1)” and not watered | 29.90° Celsius | 40.00% | dusk or dawn | 0mm - No rain | 10% |
| Forest | A little forest in Kamp-Lintfort where shade is provided the whole day by trees and other vegetation | 27.80° Celsius | 51.00% | dusk or dawn | 0mm - No rain | 8% |
| Field | Field on that maize grows, soil is loose and chunky and shade is provided by plants, is located very close to the forest | 28.70° Celsius | 52.00% | dusk or dawn | 0mm - No rain | 25% |
| Parking lot | Parking lot is paved - only under some trees, soil can be found where the measurements were taken | 29.50° Celsius | 45.00% | dusk or dawn | 0mm - No rain | 2% |
| Public park | Park with a little lake (Pappelsee) and a lot of vegetational cover, soil is very sandy since measurements are taken directly near the lake (beach-like soil with lots of little stones) | 28.00° Celsius | 45.00% | dusk or dawn | 0mm - No rain | 3% |
The map shows how near all locations, besides Garden (2), are and that some values, especially the temperature and soil moisture can differ extremely. This indicates the importance of a portable meteorological weather station for farmers.
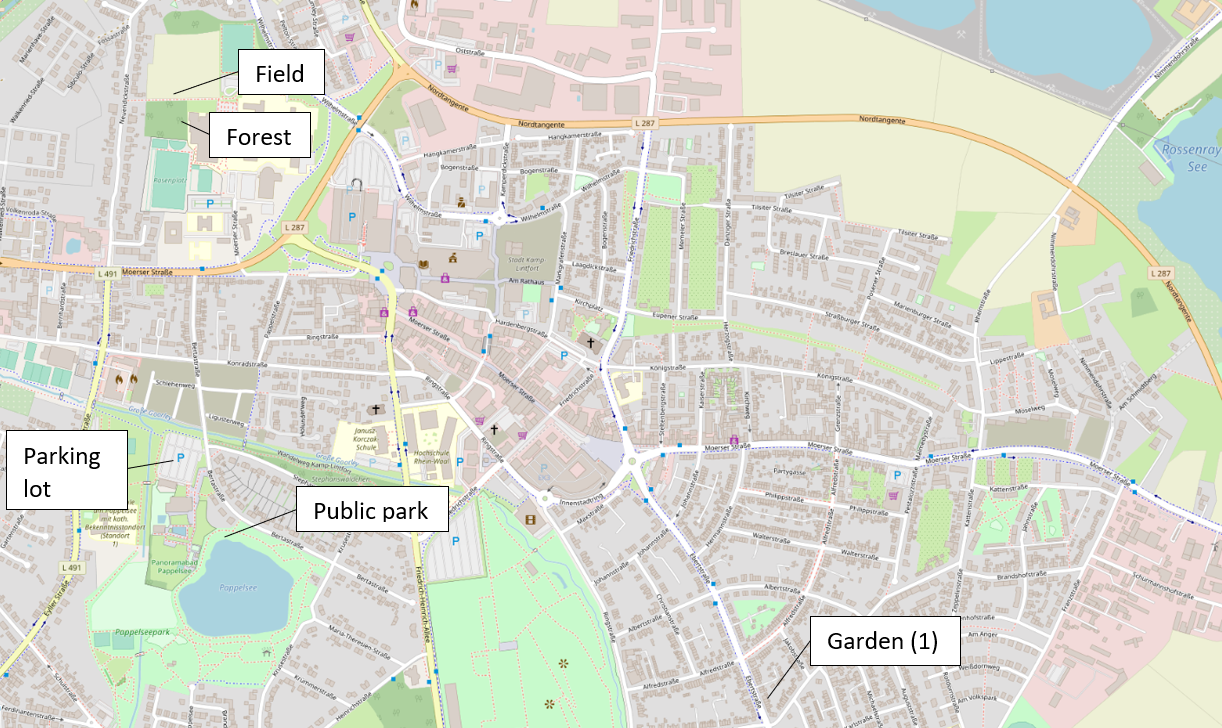
Map of locations besides Garden (2), excerpt of Kamp-Lintfort, NRW in scale 1:14000 - QGIS, Vanessa Meinert
All measurements were taken in shade to make sure that the temperature is not influenced by sunlight, since the weather was very warm on the day the measurements were taken (11th August 2020). This influences the light measurements to results that show in all cases “dusk or dawn”. The results should have been “cloudy day” since the measurements were taken in shade. For more information about the sensor and output values see “Luminosity measurement”.
Additionally, the measurements were taken between 9:00am and 10:00am. Thus, the sun stands relatively low. This might influence the results as well.
The results show that the temperature changes mostly. This depends on the location and its surroundings.
The highest temperature with 30.10° Celsius was taken in Garden (1). Here, the surrounding is most urban. Due to the missing vegetational cover, the air heats up quicker and the temperature rises.
In the forest the lowest temperature was measured with 27.80° Celsius. Here, the trees provide a constant shade that cools down the area.
Thus, a difference of 2.3° Celsius is achieved.
The other locations and its temperatures lay in the range mentioned above.
It is interesting to see that a difference of nearly 1° Celsius is achieved in two areas (Forest & Field) that are very close to each other. There is only a sidewalk inbetween that seperates both locations. This shows as well how immense a forest and its vegetation is able to influence the microclimate.
The relative humidity is 40.00% in Garden (2) and 51.00% in Garden (1). Here, the surrounding influences the results as well.
In all cases, the precipitation is equal to 0mm. A small cup was placed in all locations 24 hours before the measurements. All cups are completely empty so that no precipitation was measurable.
Lastly, the soil moisture was measured. The highest value was measured in Garden (1) with 58% because the lawn is watered daily. Thus, the soil is able to keep moisture even if the weather is very warm and the evaporation high.
The field has a soil moisture of 25%. Here it is possible that the farmer waters the field if necessary, so that the plants can grow well. If the soil moisture would be as low as in the forest (8%), in the public park (3%) or at the parking lot (2%), the plants would probably not be able to grow in a way that a good harvest can be achieved.
The lowest value was measured at the parking lot with 2% soil moisture. Since the parts where soil is present (see picture: Parking lot) is under trees, it is possible that the trees hold up most water to reach the ground. Because of the interception, most water is evaporated before it reaches the ground. Additionally, the surrounding of the parking lot is paved and a lot of buildings are present. Because of the urban surrounding, the air heats up quicker and will let the water in the soil evaporate faster.
Those changes lead to a difference of 56% if human influence through watering is considered and only 8% if this is not considered. This shows that human activity has a huge influence on quasi-natural locations.
More information about the locations can be found in the following pictures. Especially the change in soil moisture can be seen on the pictures since in Garden (1), the cover looks greener and more healthy.
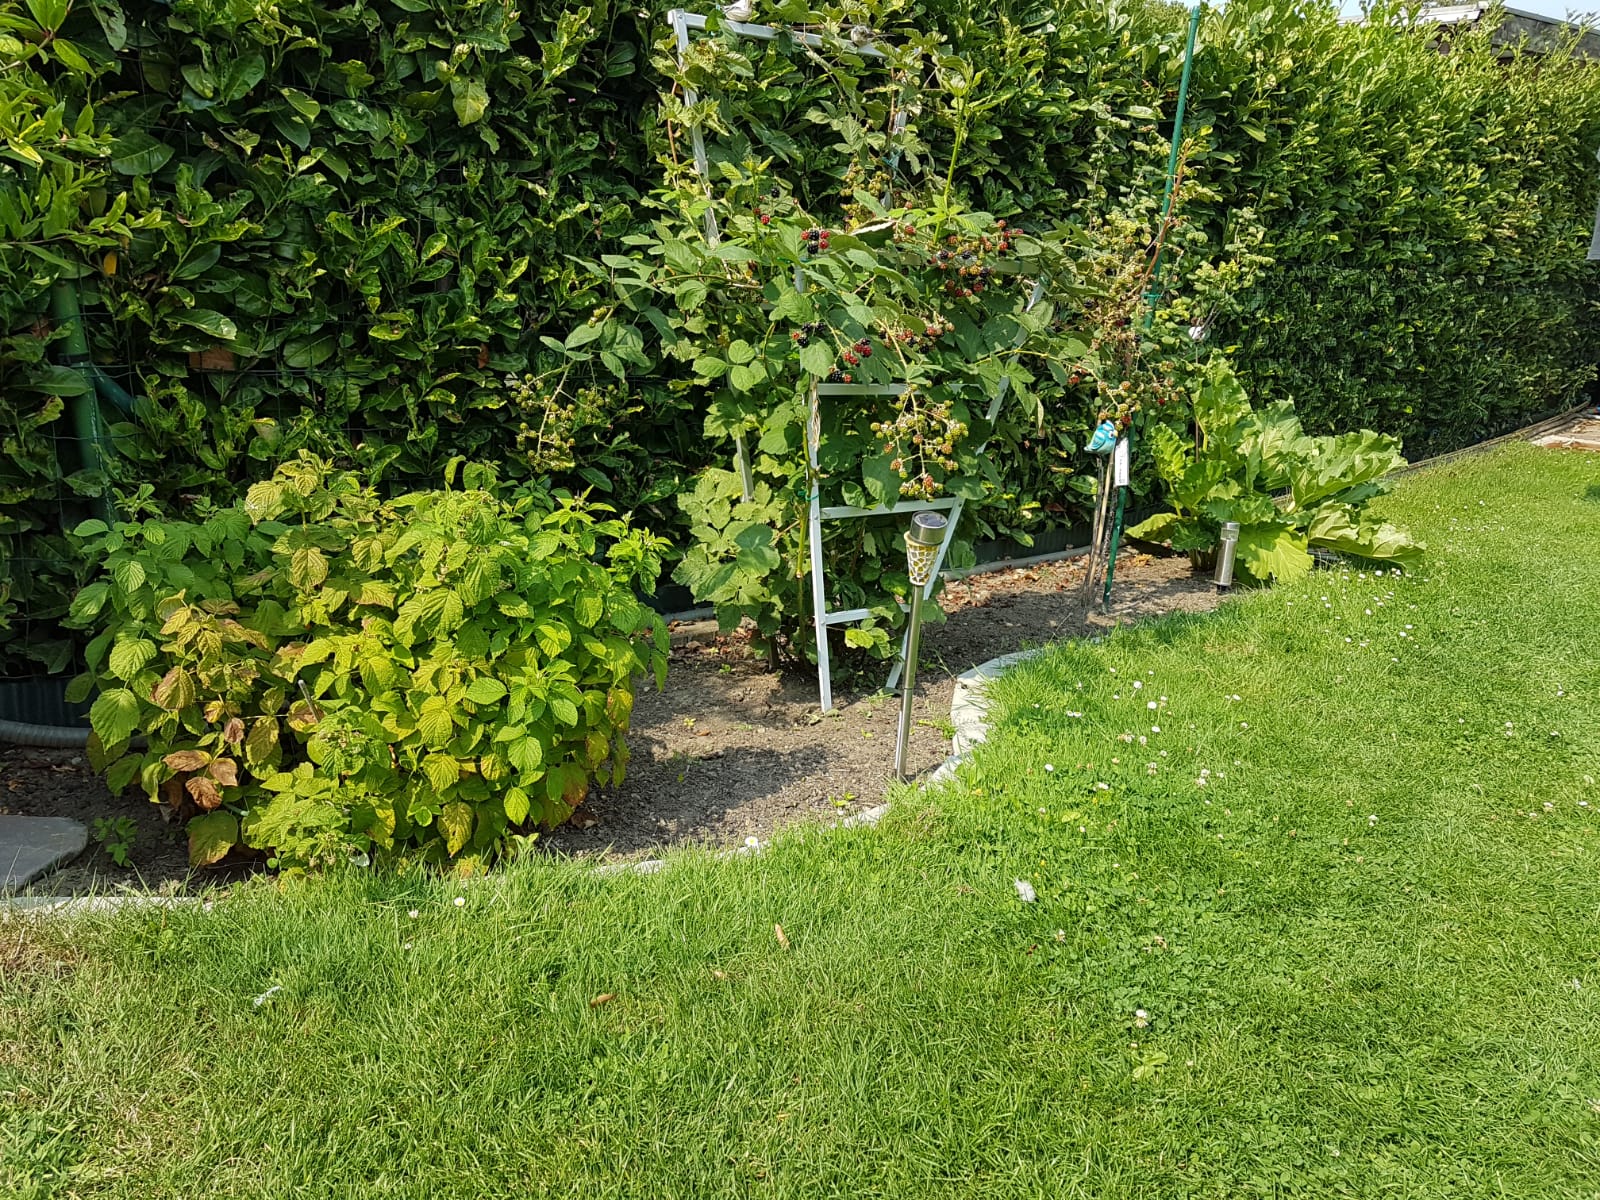
Garden (1) - measured in lawn, picture: Vanessa Meinert
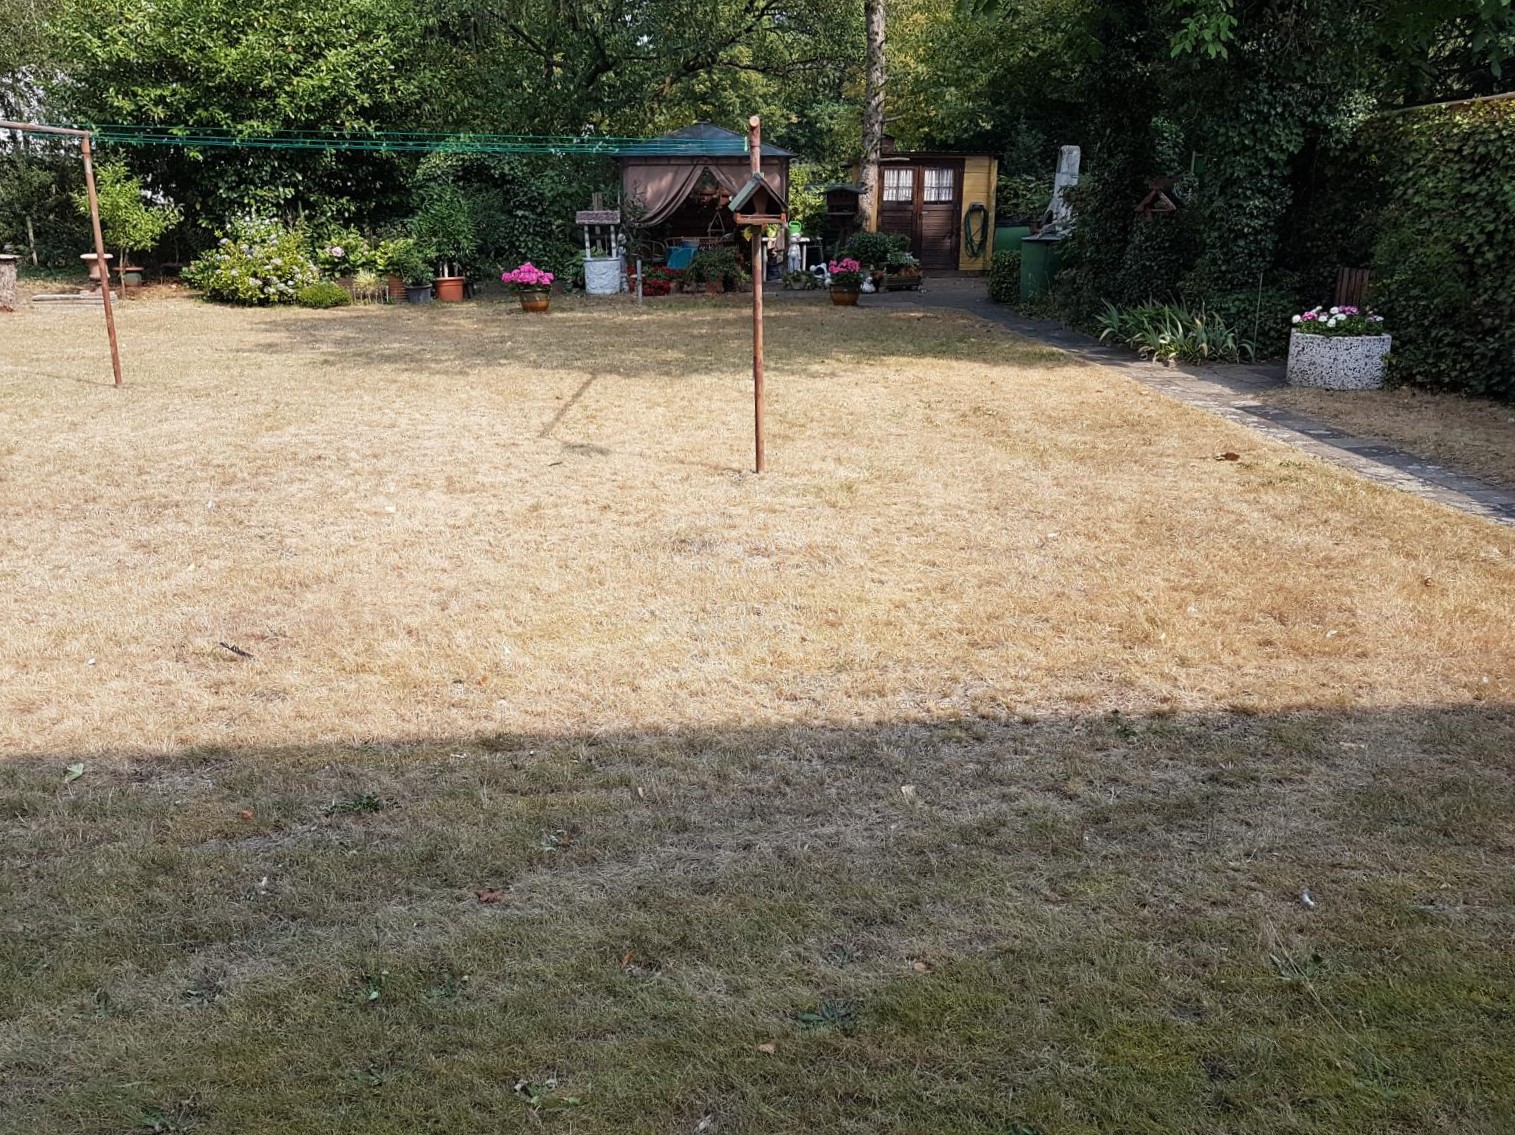
Garden (2), picture: Vanessa Meinert
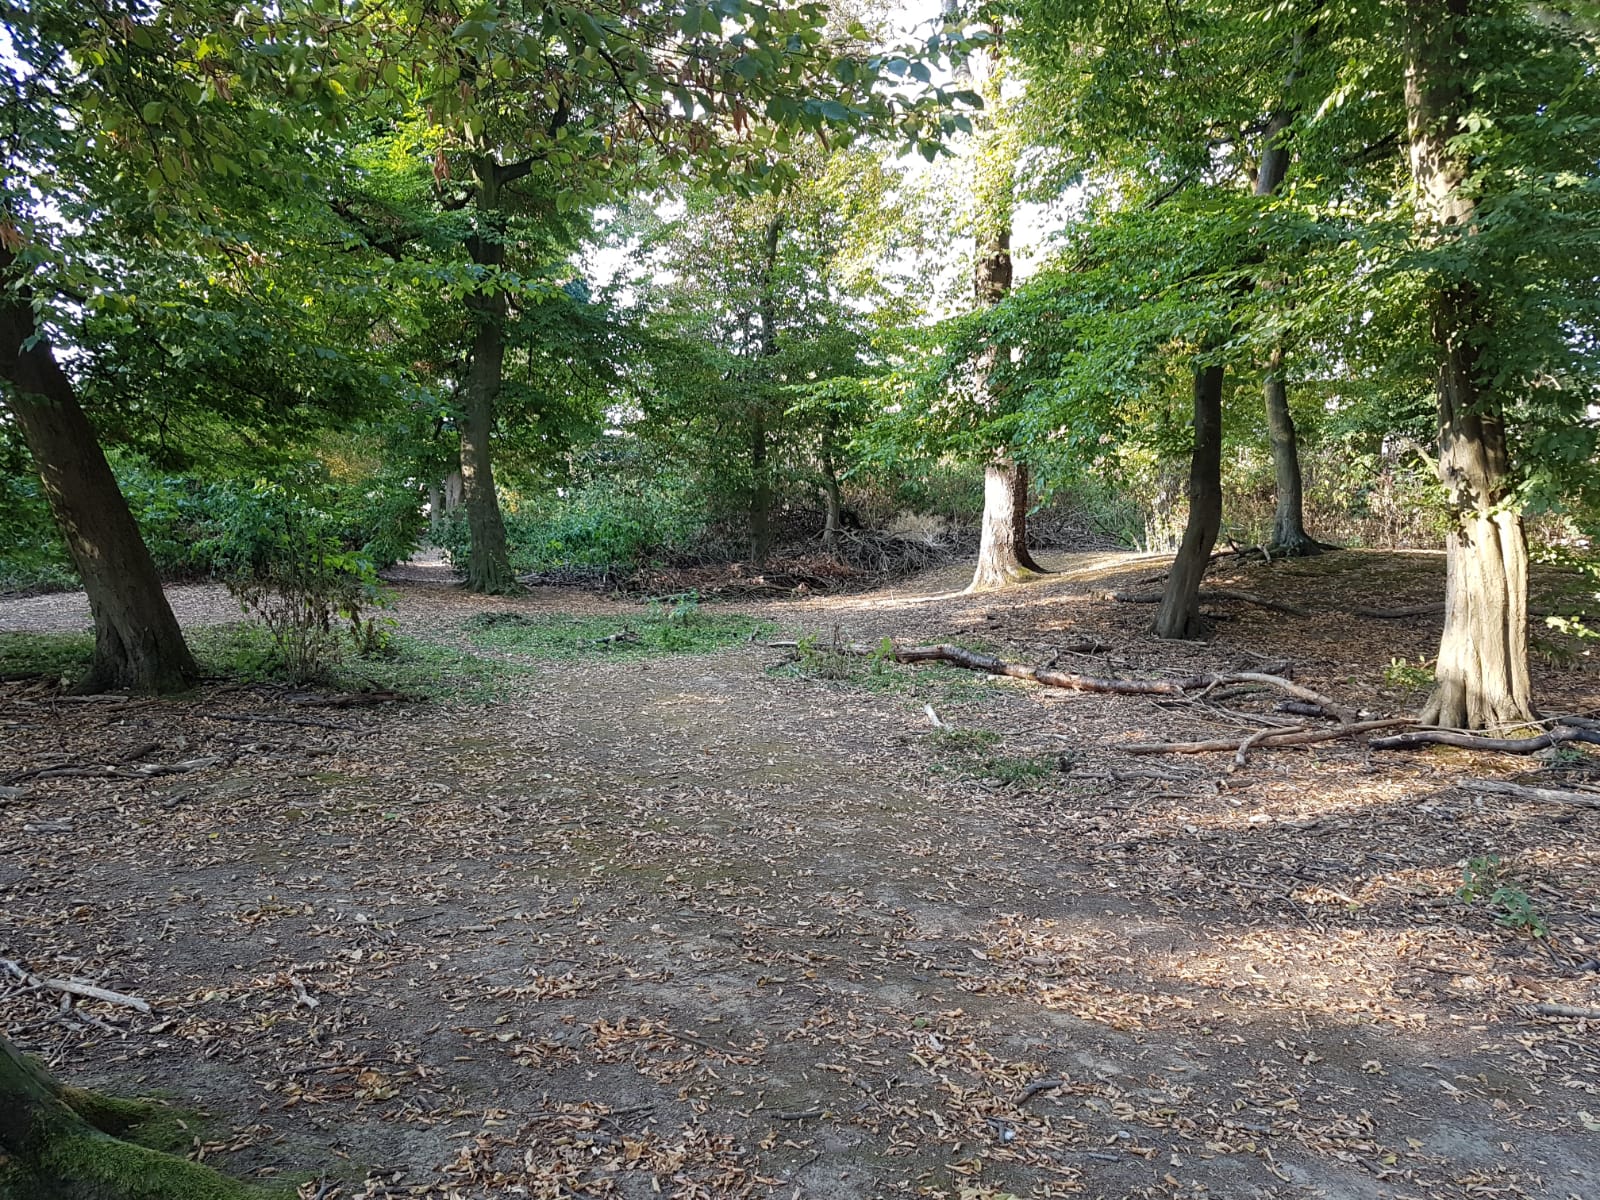
Forest, picture: Vanessa Meinert
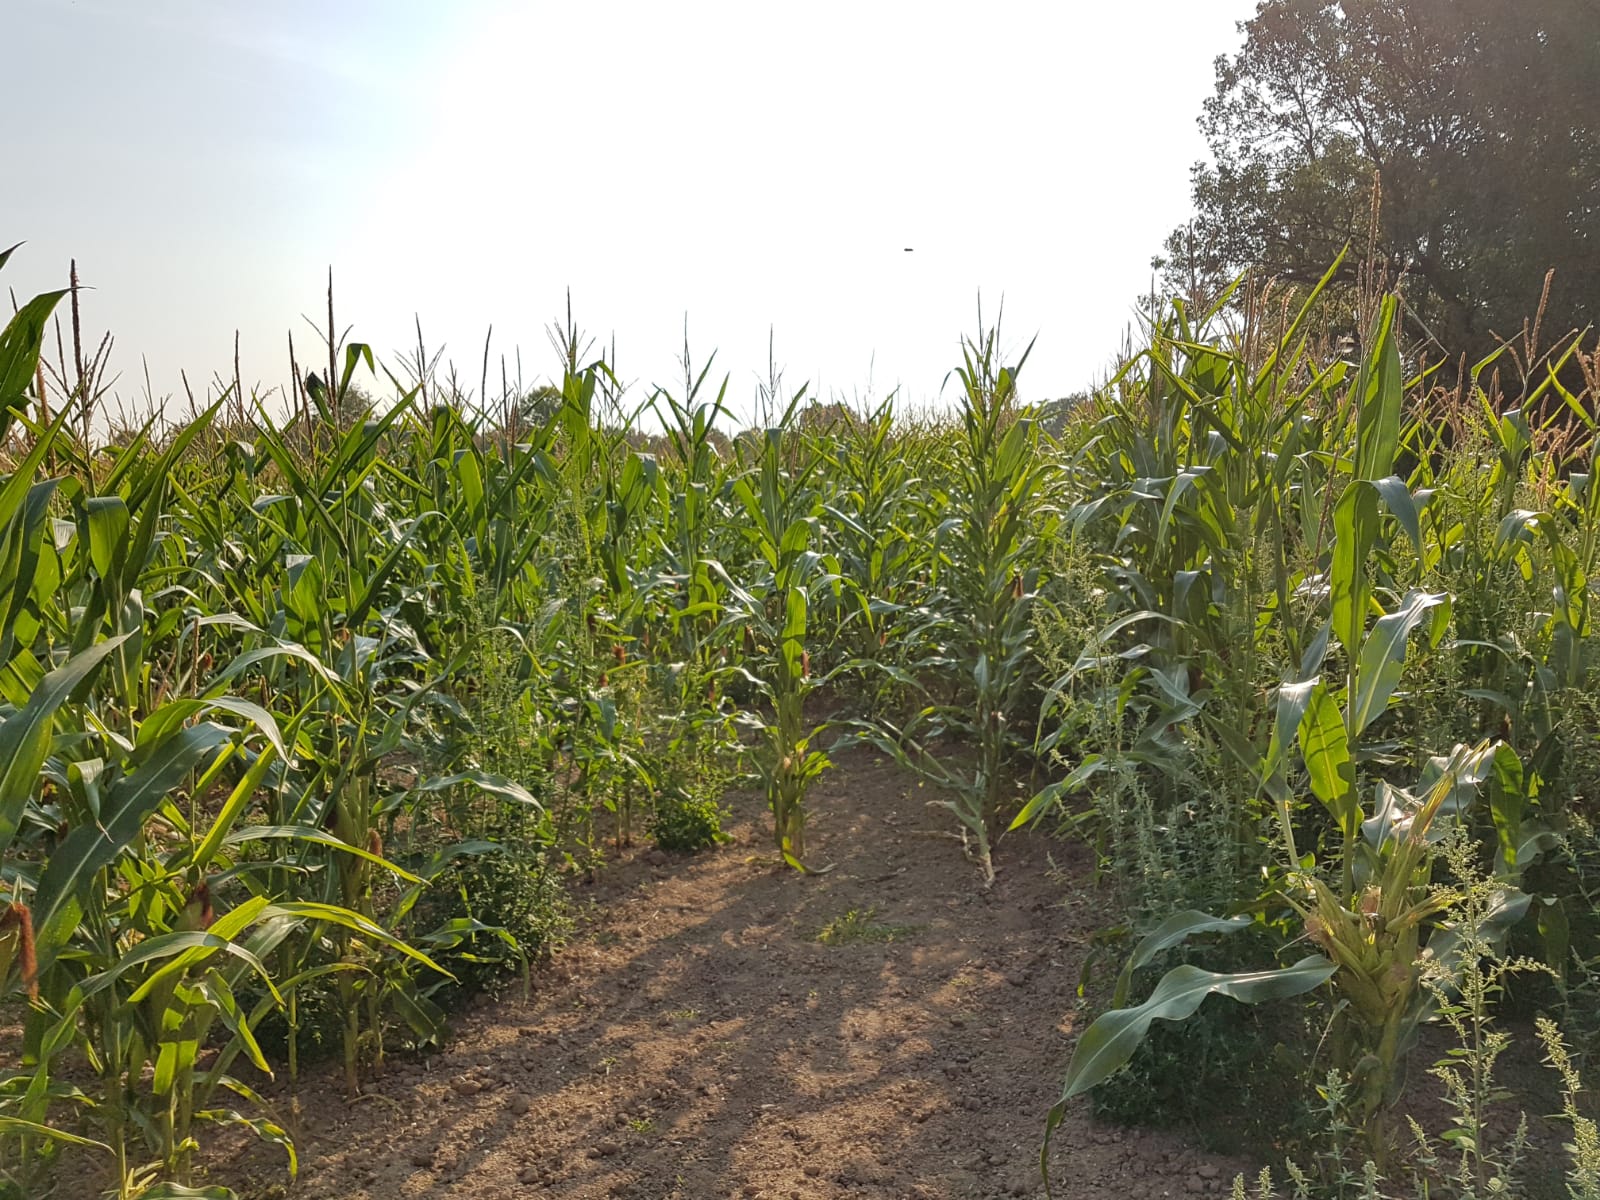
Field, picture: Vanessa Meinert
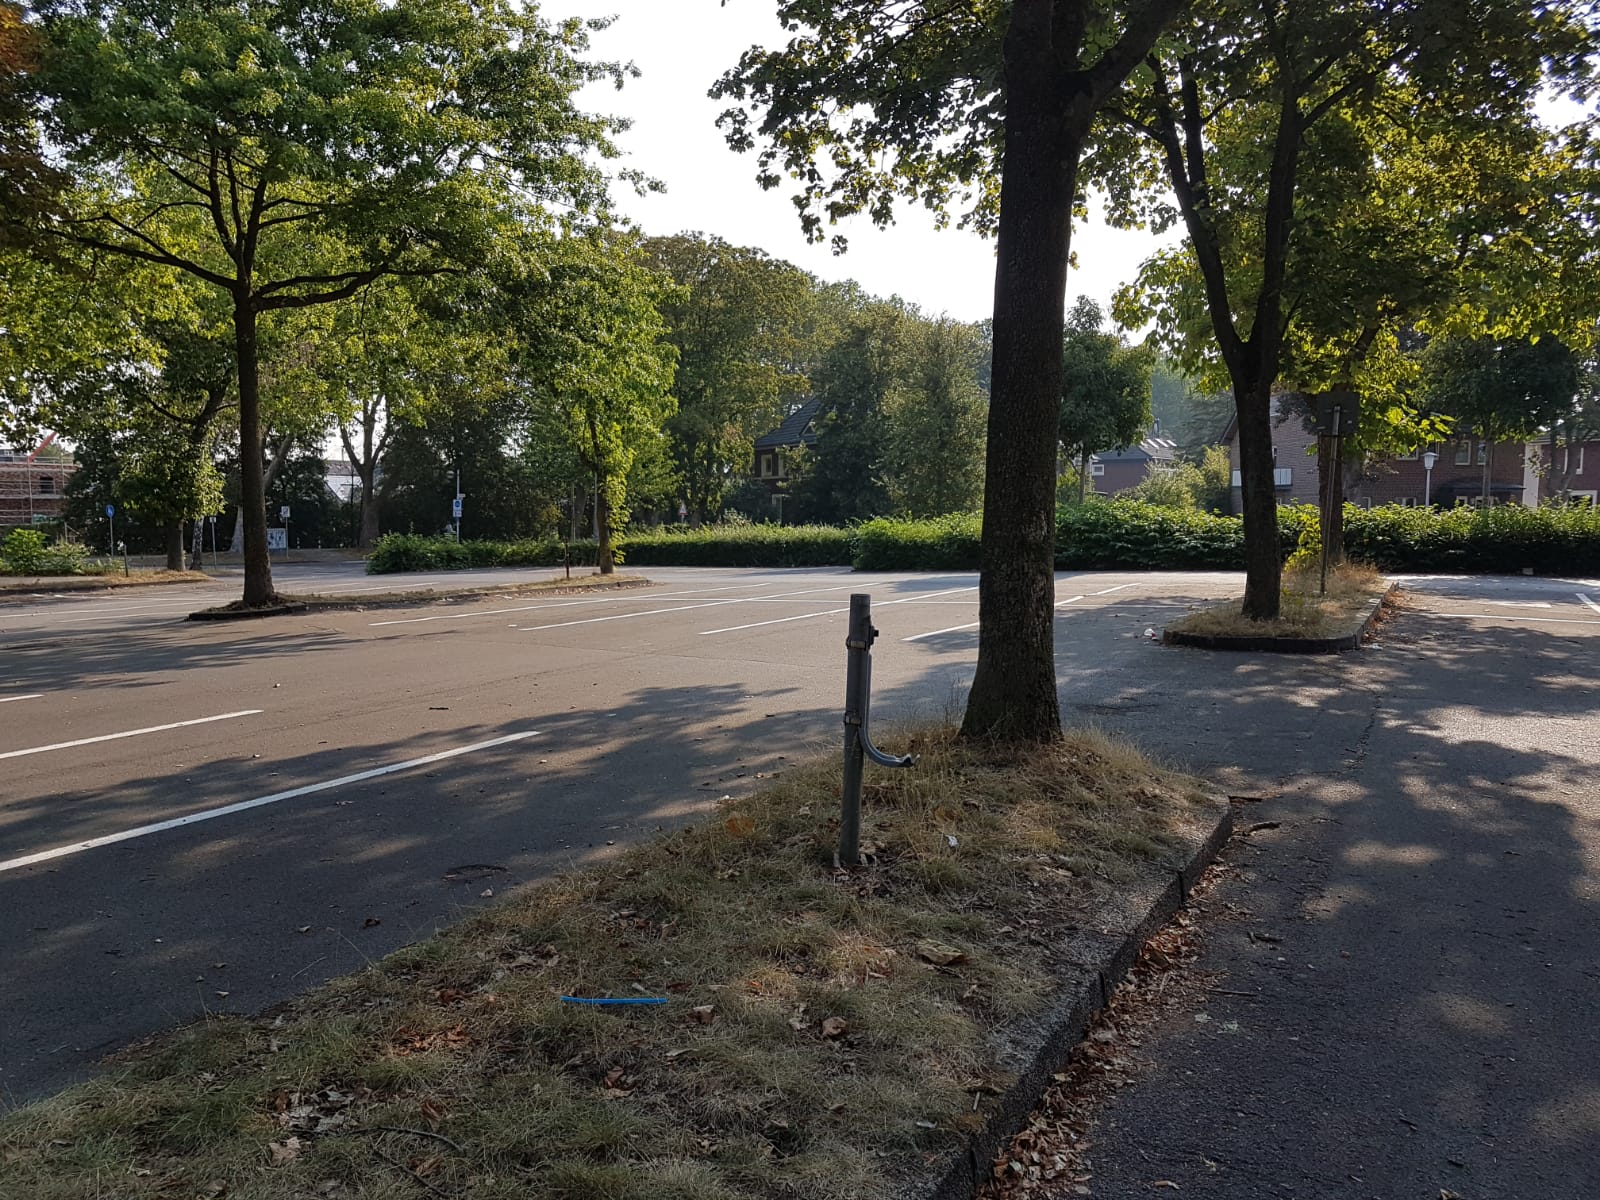
Parking lot, picture: Vanessa Meinert
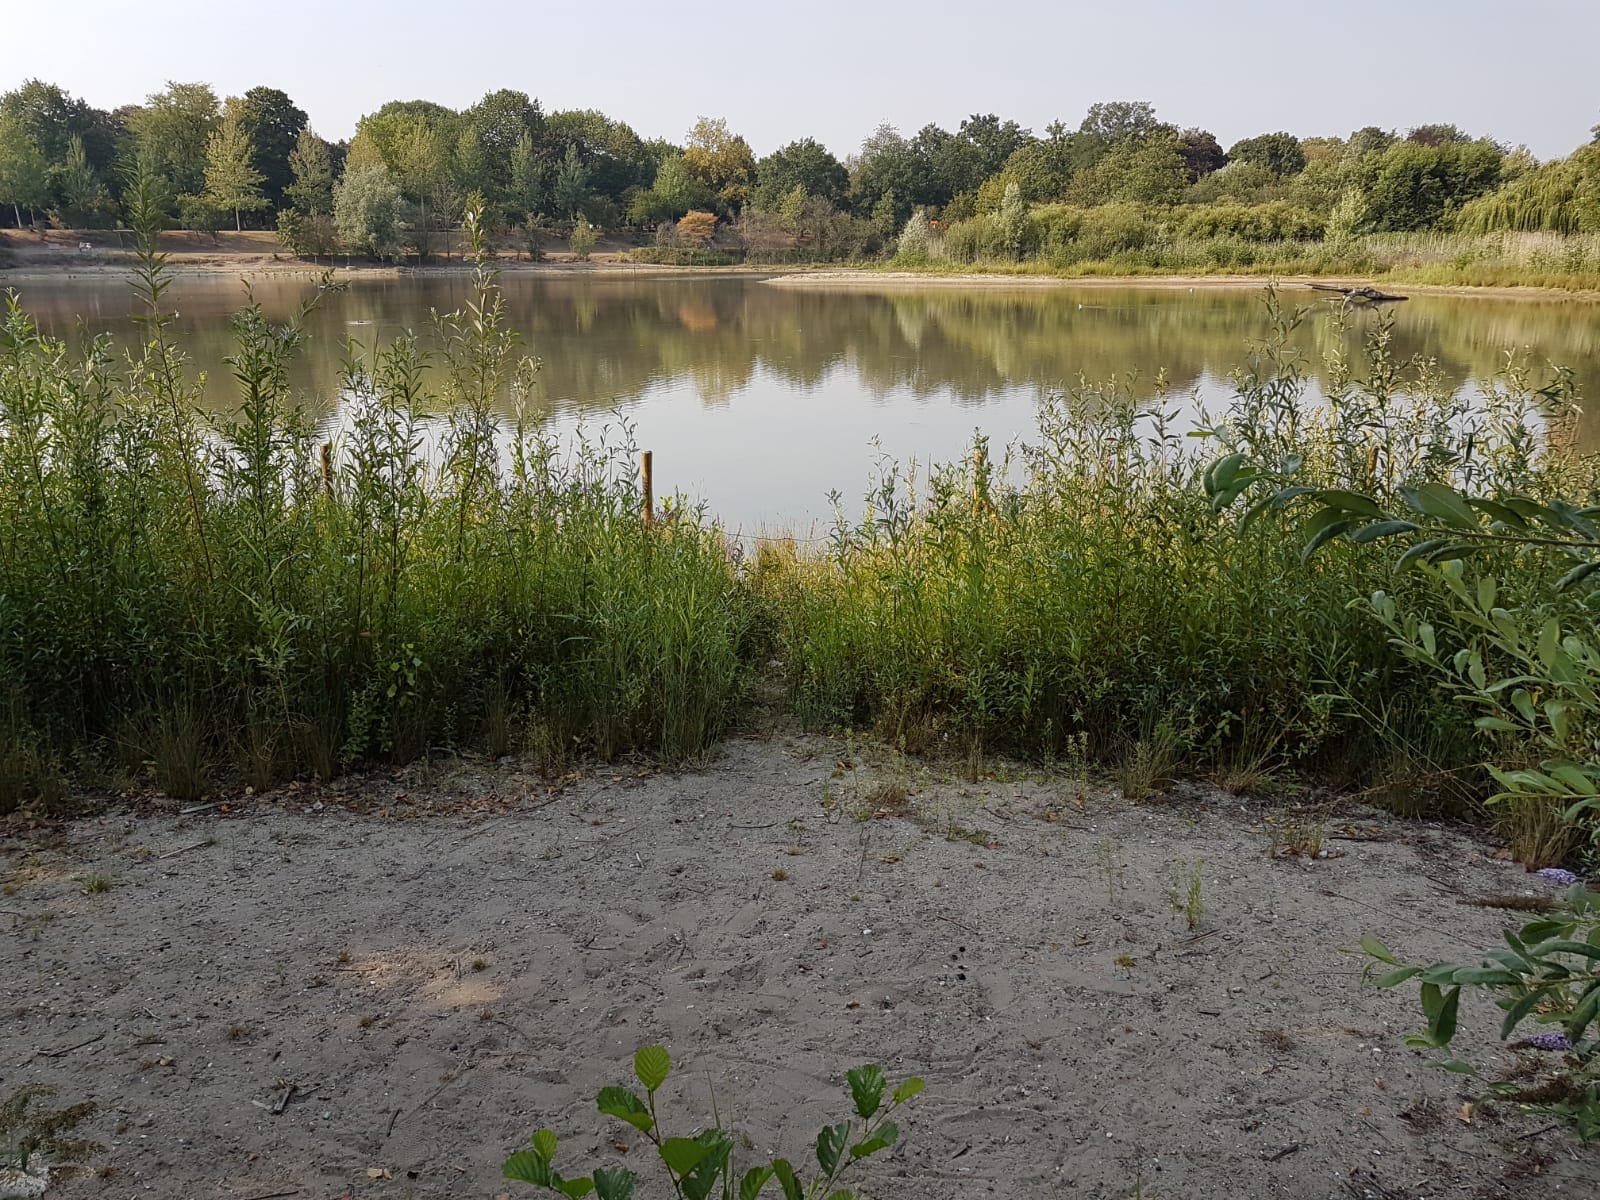
Public park (Pappelsee), picture: Vanessa Meinert
Building a Box
Skwirut
The following part will describe how the box for the measurement station was build.
The first step was to decide on a design so that each sensor could fit in the box and still perform. All four sensors need specific details. Starting with the photoresistor, for this sensor the light supply is needed. Therefore, a hole on the roof of the box is cut out so big that the sensor can fit through easily. To prevent it from rain a transparent plastic cap is attach to the roof. To keep the sensor in place some additional formable cables were soldered to the sensor.

Box(1) Photoresistor, Picture by: Skwirut
For the DHT11, there are gaps cut out on the front side of the box which guarantee the air supply so that the temperature and humidity outside and inside are the same (or mostly similar).

Box(2) Front gaps, Picture by: Skwirut
For the soil moisture sensor, a hole is cut into the floor of the box so that the sensor can reach out but not fall out from the box. At the same time this gives the box some stability against wind. The box is placed on four plastic stands so that the floor of the box would not touch the ground directly and also the sensible parts of the soil moisture sensor would not get in contact with water.

Box(3) Bottom of the box, Picture by: Skwirut
The water level detection sensor/ precipitation sensor can be placed through a smaller hole on the bottom of the box next to the soil moisture sensor hole to measure the water level. It can also go through the side of the box to measure precipitation. Here it is dependent of the side from which the rain will come because it could be covered by the side of the box. The sensible parts of the sensor are mostly inside but to have a good protection it is also covered by a small plastic layer and fixed with elastic bands which also gives stability to the sensor. There is also the possibility to measure the exact amount of precipitation by placing the Water level detection sensor inside a rain gauge. The code presented before is intended for this application.

Box(4) Right side of the box, Picture by: Skwirut
Both sensors can be put into the box for easier transportation. The material for the box is wood which is thin so that it would not burden the Wi-Fi connection and heat up too much on the inside.

Box(5) Cutted wood pieces for the box, Picture by: Skwirut
The boxes’ height is dependent on the breadboard’s length, the width is chosen so that all cables and sensors can easily fit in. To make the box waterproof all parts were painted with “Wetterschutz Holzgel” which makes the wood water resistant.

Box(6) Painted wood pieces of the box, Picture by: Skwirut
To give the box some stability on the inside the walls are stabilized due to little wood bricks.

Box(7) Wood bricks on the inside of the box, Picture by: Skwirut
To open the box a little door is build-in on one side.

Box(8) Door on the left side of the box, Picture by: Skwirut
The bread board with all sensors and cables connected is then placed on the inside with the help of double-sided adhesive tape. All parts are glued together with specific waterproof glue for wood.

Box(9) The build box, Picture by: Skwirut
Video Tutorial
Video: Skwirut and Meinert, Text: Skwirut
The following video will describe the fields of application for our portable meteorological measurement station as well as describe the different sensors which were used. It will be also showed how the box is used and the design will be shortly described. In the end the box will be showed in action.
Discussion
Skwirut
The goal of the project was to create a small-scale measurement station, to analyze the micro climate of a surrounding. In the process of building the mobile station many obstacles occurred. We figured out some limitations for the station, that are going to be explained in the following part.
After the code for each sensor was written and also connecting worked mostly fine for the Arduino board, the change to the ESP32 had difficulties.
The first problem was to figure out, how to connect the board to the Wi-Fi. This it took especially long due to the fact that there are various ways to do it but many codes are difficult to understand also the strength of the Wi-Fi connection at each home is of different quality. In our case all of us had poor to medium connection, which had the effect that even when a code would work it would not connect. This leads us also to the problem that the ESP board needs a nearby Wi-Fi connection to use it on the fields or garden. The problem is that many fields do not have such far reaching connections on the fields yet. We think this will change in future due to the fact that more and more agriculture work will be done with the help of Wi-Fi to control instruments and machines more easily and effective. In contrast to the Arduino board it has the advantage that you do not have to go to the place and connect your laptop. After we managed to move the sensors to the other board, we thought about the problems the station might have.
Secondly, we tested both the Arduino and the ESP32 version of our project. Here we could see that the sensors by the ESP32 were less sensible which leads to less exact measurements. For example, the LDR (Photoresistor) is less sensible in case of the ESP version and shows the same values for different light conditions. It was much more sensible by the Arduino board.The same is true for the water level sensor.
Thirdly, another problem is the soil moisture sensor. It works fine on its own and also when the other sensors are connected to the ESP32 board. But the results can only be represented properly, if the soil moisture sensor values are printed separately from the other results. If printed together with the other sensor readings, it is not printed correctly and also disturbs the arrangement of the other printed results. This is a bug we could not fix properly on our owns.
Fourthly, it became clear that the station could not be used effectively outside in this state. The biggest problem was that the station is not weatherproof. In the event of rain, for example, it would damage the individual sensors and the board.
Therefore, we decided to build a box. The problems which occur by building it were, to design it. Another problem might be that the often usage of the soil sensor and water level sensor might cause corrosion.

Water level detection sensor which starts to corrode, Picture by: Meinert
The fact that it is a mobile station could help to reduce this problem. This sensor would be removed often from the soil and water. A problem occurs also by the water level sensor when for example rain water dries on the top it can contain dirt which than stays on the sensor and dries there. Later on it can cause problems for the measurements.
The next limitation is the high energy consumption. Our energy source would be a Battery. The problem is it measures all the time. For people who want to have a station at one place the deep sleep mode would be a solution, another solution could be installing a solar panel on top of the box. Due to the fact that our station is mobile and is meant to be moved the consumption is not so much of a problem for us because the energy source can be connected and disconnected in the time when it is used and not (like while transporting or when measurements are not necessary). Also, the station is only meant to make measures for at maximal 2 weeks in one run but not longer. In this time enough data for analyzation can be collected.
All in all, it can be said that the measurement station can be developed even more but for small-scale applications it is enough.