amc2022:grouph:start
Table of Contents
1. Abstract
Our project is based on the idea of being able to monitor the air quality of any place with a simple cost effective kit. In the market there are lots of options at high prices with questionable reliability. Our intention is to give a step by step breakdown of how with an Arduino kit anyone is able to build their own air monitor. The importance of this project relies on two things: using accessible materials and learning how to program those materials to access the data and have a visual representation. At the heart of our project is the utilization of the ESP-32 micro-controller which WiFi capabilities allows the user to send and store information online. Furthermore, by integrating different online services such as Node-Red and Grafana, anyone can have instant access to the information stored for further analysis and/or comparison.
2. Introduction
We are susceptible to environmental elements that can have harmful effects on our health. One of the most important factors to consider is the quality of the air we breathe, unfortunately most of us are not conscious of what is in the air and how through time the elements in the air we consume change. For that reason we have developed a tool that allows anyone with an Arduino Kit and comprehensive, but easy to follow coding to collect, send and represent data describing the air quality through time of the place where the station is placed.
The exposure to harmful air elements is of great importance for governments around the world, and many laws have been enacted to protect people at work and at the places where they live in order to reduce the exposure to harmful elements, however a lot can still be done and people need to be aware of the environment surrounding them. According to the World Health Organization, 3.2 million deaths occur every year around the world due to exposure at home to smoke from dirty cookstoves and fuels and is estimated that 4.2 million deaths a year are due to exposure to outside air pollution. Finally “9 out of 10 people worldwide live in places where air quality exceeds WHO guideline limits``.1) While housing codes requires the installation of Carbon Monoxide and Smoke detectors, they only alert when thresholds are exceeded, but we are not able to see how through the day or months those values are changing, additionally there is a strong correlation between air quality and the proximity to busy street intersections or industrial complexes, that is where the air quality device would inform the user of the status of the air they consume, and with time the data gathered has the potential to give out important information about the status of the environment.
A few key indicators provide most of the data necessary to assess the quality of air. Due to industrial processes and the burning of fossil fuels for energy production we can anticipate some of the most frequent gas components that can cause harm. The Arduino Kit in combination with the ESP-32 micro-controller and adaptable sensors are able to “read” the quality of the air and translate it into data that we can see and understand. The microcontroller is able to process the data and transmit it over Wifi, where online tools like Grafana are able to visually represent the data of any required period of time to produce graphs that are very informative.
The device is made as a reliable indicator of possible common harmful elements in the air, its portability and connectivity allows for its use in almost any setting and most importantly the low cost of making it combined with easy to follow instructions, makes it an accessible tool that anyone can invest into.
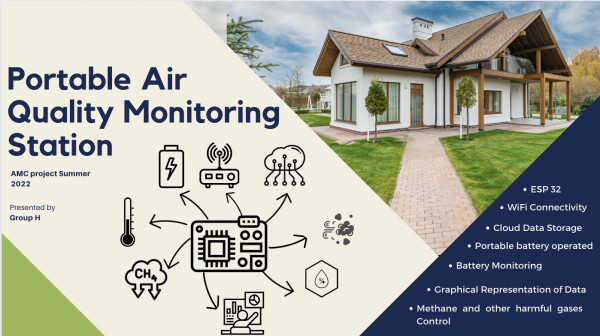
Key device features used for this project are: Connectivity, Portability and Data Management.
3. Method
 |
|---|
| figure 1 Setup showing the connections of sensors to ESP32 |
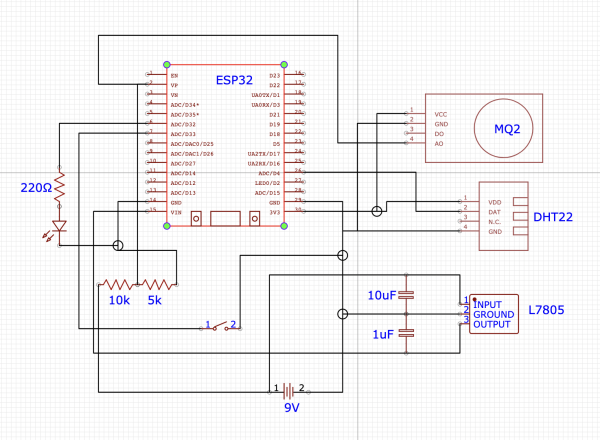
| figure 1.1 Schematics |
3.1 Temperature and Humidity Measurement
The DHT-22 sensor is a dual system peripheral that is able to measure temperature and humidity. Its use has many applications in different settings. Due to its easy operation and low cost, a wide range of projects rely on the sensor to get accurate readings. From terrariums to weather stations and automated climate control systems, the usability of the sensor proves to be a great tool. In determining Air quality it is very important to measure both temperature and humidity, since it has direct effects on the health of a person. Knowing those 2 factors can help the user get an overall picture of the environment surrounding her or him.
For our purposes we initiated this project with the DHT-22 sensor because it was simple to install and program, but we also believe that for any upgrading of the system or expansion to a more complicated set-up in the field of ambiental measuring, the temperature and humidity are a must. Additionally the ability to save the data collected and to be represented in Grafana allows the user to have a better understanding of things that could be done in order to improve the Air quality of the room or apartment, for instance the user can see in detail how closing the curtains on hot summer days can help maintain the space cooler, or how high humidity in closed spaces can have negative consequences such as the proliferation of mold which both causes damages to the property and has negative health risks. A great place to have the Air Quality station would be a basement or an attic, where lack of moving air tends to create a setting where polluting particles and gasses can accumulate without the owner or user of the space being aware.
Description of how the DHT22 sensor works can be found here.
3.2 Air Particles Measurement
Particle Matter are small solid particles and water droplets that are found in air. The size of those particles vary greatly, some we can see with our naked eye, such as pollen, dirt and smoke, while others we need tools like microscopes to detect them. The significance that the presence of those particles have on our health depend on such factors as type of particle, quantity and duration of exposure2). Due to industrialization and all that it entitles in terms of development, material use and lifestyle, we humans are now more than ever exposed to higher concentrations of harmful particles that are the culprits of multiple diseases. Determining the quality of the air we breath is directly related to knowing how many and what type of those particles are present in the air. Therefore, we have used the MQ2 sensor which not only detects certain types of particle matter but also its concentration.
Listed below are limit threshold amounts for different particulate matter in the air at which the health risks are moderate. There are many sources and depending on where you obtain your source the number may vary.
For an explanation of how the sensor works and how we implemented it in our Air quality device please follow this link MQ 2
3.3 MQTT Database and WiFi Connection
In other to connect ESP32 to the MQTT Broker, the ESP32 must be connected to the internet. Since ESP32 supports wifi, it could easily be connected to the local wifi by writing some lines of code on the Arduino IDE.
To start we use the ESP-32 micro-controller that has very important features, WiFi capabilities to transmit information digitally over any network connection which almost everyone has access to in their houses or workplaces. Additionally, one can connect the controller to a Mobile Hotspot if doing field air quality assessment where no WiFi is available but there is cell phone connection.
MQTT is a client-server publish/subscribe messaging transfer protocol. It uses the TCP/IP protocols to interconnect network devices to the internet. MQTT connects the Client to the server and provides the means to send an ordered, lossless, stream of bytes in both directions. MQTT Broker is computer software, which enables MQTT clients to communicate. MQTT brokers receive the messages published by clients, filter the message topics, and distribute them to subscribers. A client establishes the network connection to the server by:
- Publishing messages to other clients
- subscribing to request messages
- can unsubscribe and disconnect from the server
A server acts like an intermediary between the publishers and subscribers. A server accepts network connections from clients and messages published by the clients. A server also processes the subscribe and unsubscribe requests from clients. Furthermore, a subscription is comprised of a topic filter and maximum Qos. Each subscription within a session has a different Topic filter. Before data/message is published, a topic name is required. The topic name must match against the subscription known to the server. The message is sent to each client that has that matching topic name. In this project, an MQTT Broker called MQTTX was used to transmit data from the sensors below, where the data was then stored in a data base (influxdb) and then visualised using Grafana as shown on figure 2 and 3 below.
MQTTX
 |
|---|
| figure 2 Publish and subscription on MQTTX |
Node Red
 |
|---|
| Figure 3 setup on node-red showing data from mqtt being stored in a data base (influxdb) |
3.4 Battery Voltage Measurement
Since our device is powered by a battery for portability, it is important for us to know the status of the battery. To measure the battery's voltage we can use a multimeter, but we want to integrate the capabilities of the microcontroller to read voltages through its Analog to Digital Converter (ADC) pins. Not only is this a more efficient approach by reducing costs but it can also help us access the information online, where we are able to not only check the status of the battery in Grafana, but we would also know when to replace it or even make changes to the sensors or code to improve performance. The setup is done with the concept of creating a voltage divider. This is achieved by creating a circuit within a bigger circuit and obtaining a reduced voltage with the introduction of resistors connected in series. As shown in Figure #.

| Figure 4 Source: https://www.electroniclinic.com/what-is-a-voltage-divider-or-potential-divider-formula-and-practical-uses/ |
Why we would lower the voltage is due to the micro-controllers specifications. The input voltage cannot exceed 3.3V, otherwise we would risk damaging the controller. ESP-32 analog channels are of 12 bit which means the minimum step of each voltage level is between 0 and 4095 or 212. Analog channel produces a digital value between 0 and 4095 according to the voltage at the input of the analog channel8), therefore:
- If the voltage is 0 at the input of the analog channel, the digital value will be zero.
- If the voltage is 3.3 volt at the input, the digital value will be 4095. So the maximum voltage limit is 3.3 volt.
Because the battery used is 9V, we want to make sure that the ADC pin only receives up to 3.3V. Knowing both the Voltage source, the Output Voltage and one of the resistor values, we can then find the other resistor that would complete our circuit by using the Voltage/Potential Divider equation of Figure 4. There are plenty of websites that have very easy to follow tools to find any of the values of our equation. For our purposes we used https://ohmslawcalculator.com/voltage-divider-calculator. Alternatively by knowing the resistors used we can calculate the output voltage. Since we are using the hardware provided in the ELEGOO KIT, we have decided to use one 10k Ohms and one 5k Ohms resistors connected in series, which provide us with an output voltage of 3V.
Description and Results can be found on this link.
3.5 Deep Sleep Mode and Power Saving
The use of a battery for power supply has a drawback, limited amount of energy available. With the integration of the sensors and the continuous use of the microcontroller the battery life would last a very short period of time, therefore certain measurements have to be placed in order to limit power consumption and expand the battery life. ESP-32 has Sleep Modes, which are power consumption settings that limit the use of peripherals and components until the device is awakened again. This setting is very important in that the user can select what components of the micro-controller are to stay active depending on the necessity of the project. For ESP-32 the following power modes are available:
- Active
- Modem-Sleep
- Light-Sleep
- Hibernation
- Deep-Sleep
The specifications for the power consumption of each of the Sleep modes can be found on this datasheet.
For the purposes of this project we have selected Deep-Sleep mode. In it only the Real Time Clock (RTC) module, which keeps track of time and date in the absence of an external power supply, and the Ultra-Light Co-processor (ULP) module which purpose is to perform readings through the ADC and I2C pins, remain active while the main processor is in Deep-Sleep mode as shown in Figure 5.
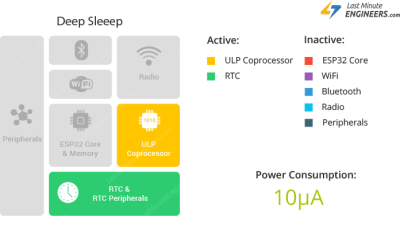
| Figure 5 ESP-32 Active Components during Deep Sleep mode. Source: https://lastminuteengineers.com/esp32-sleep-modes-power-consumption// |
Deep Sleep mode allows us to perform the following tasks:
- Only use the device on a specified interval, since we only want to measure the Air Quality of the ambient every # minutes.
- While not in use, conserve as much power as possible.
- Keep RTC clock active to set up the alarm that will turn on the device and sensors.
- Have an external pin that can be used to wake up the system on command.
Complete description of the set-up procedure can be found here.
4. Materials
5 Codes and explanation
/**********************************
 * AMC group 5 2022
 * Monitoring air quality.
 */

/*******ESP32 wifi connect***********************************************************************************/

#include <WiFi.h>                                            /*wifi library*/
#include <PubSubClient.h>                                    /*library that allows you to subscribe and publish mqtt messages*/
const char *ssid = "";                                       /*wifi network name*/
const char *password = "";                                   /*WiFi password*/


/********MQTT Broker******************************************************************************************/

*Several topics can be created for each sensor
*connecting to a host and a server
*/


const char *mqtt_broker = "broker.emqx.io";                      /*mqtt broker/server*/
const char *topic_up = "/amc2022/group5/up";                     /* topic name*/
//const char *topic_DHT22 = "/amc2022/group5/DHT22";
//const char *topic_MQ2 = "/amc2022/group5/MQ2"
const char *topic_down = "/amc2022/group5/down";
const char *mqtt_username = "";                                  /*add username if needed*/
const char *mqtt_password = "";                                  /*add password if needed*/
const int mqtt_port = 1883;                                      /*mqtt port*/


/******Temperature and Humidity DHT22****************************************************************************/

#include <DHT.h>                                            /*importing library for DHT sensors*/
#include <DHT_U.h>
#define DHTPIN 4                                            /*connect DHT22 to pin 4 of the esp32*/
#define DHTTYPE DHT22
DHT dht(DHTPIN, DHTTYPE);                                   /*calling dht pin, and dht sensor type from imported libraries*/


/********INSTANTIATING A CLIENT TO CONNECT TO THE SERVER**********************************************************/
WiFiClient espClient;             /*client class: creates a client that can connect to a specified internet IP address and port.*/
PubSubClient client(espClient);   /* creating partially initialized client instance*/


/********Message**************************************************************************************************/

long lastMsg = 0;
char msg[80];                     /* Message buffer size*/
int value = 0;


/***********JSON****************************************************************************************************/

#include <ArduinoJson.h>
DynamicJsonDocument doc(1024);                         /*allocating memory pool(for storing data)*/


/******** Deep sleep for power saving*******************************************************************************/

#define uS_TO_S_FACTOR 1000000                         /* Conversion factor for micro seconds to seconds */
#define TIME_TO_SLEEP  600                             /* Time ESP32 will go to sleep (in seconds) */

RTC_DATA_ATTR int bootCount = 0;

int GREEN_LED_PIN = 33;
int RED_LED_PIN = 32;


/*****************Defining Battery status *************************************************************************/

#define ADC_PIN 34                     /*battery pin on esp32*/
#define BATT_MAX 5                     /*Maximum voltage from power source*/
#define BATT_MIN 3.2                   /*minimum voltage*/
#define BATT_LOW 3.4                   /*indicates low, battery needs to be recharged/ changed*/


/***********Globals for battery status*****************************************************************************/

int pinreading;                        /*define pin on esp32 board*/
float bat_voltage;                     /*define battery voltage*/
int batt_percentage;                   /*define battery percentage*/


/************************defining mq2sensor**********************************************************************/
/************************defining other Hardware Related Macros**************************************************/


#define         MQ2PIN                       (36)       //define which analog input channel you are going to use
#define         RL_VALUE_MQ2                 (1)        //define the load resistance on the board, in kilo ohms
#define         RO_CLEAN_AIR_FACTOR_MQ2      (9.577)    //RO_CLEAR_AIR_FACTOR=(Sensor resistance in clean air)/RO,
                                                        //which is derived from the chart in datasheet


/***********************Defining Software Related Macros for mq2********************************************************/

#define         CALIBARAION_SAMPLE_TIMES     (50)    //define how many samples you are going to take in the calibration phase
#define         CALIBRATION_SAMPLE_INTERVAL  (500)   //define the time interval(in 500 millisecond) between each samples in the
                                                     //calibration phase
#define         READ_SAMPLE_INTERVAL         (50)    //define how many samples you are going to take in normal operation
#define         READ_SAMPLE_TIMES            (5)     //define the time interval(in millisecond) between each samples in
                                                     //normal operation


/**********************defining Application Related Macros for mq2******************************************************/

#define         GAS_HYDROGEN                  (0)
#define         GAS_LPG                       (1)
#define         GAS_METHANE                   (2)
#define         GAS_CARBON_MONOXIDE           (3)
#define         GAS_ALCOHOL                   (4)
#define         GAS_SMOKE                     (5)
#define         GAS_PROPANE                   (6)
#define         accuracy                      (0)   //for linear-curves
#define         accuracy                      (1)   //for nonlinear-curves, un comment this line and comment the above line if                                                                       \\                                                    calculations
                                                    //are to be done using non linear curve equations


/*****************************Globals for mq2***********************************************************************/

float           Ro = 0;                            //Ro is initialized to 10 kilo ohms

void setup() {
  Serial.begin(9600);                              /*sets data in bits per second(baud) for serial data transmission*/

  dht.begin();                                     /*start dht22 sensor*/


/******CONNECTING WIFI***************************************************************************************************/

  WiFi.begin(ssid, password);
  while (WiFi.status() != WL_CONNECTED) {
    delay(500);
    Serial.println("Connecting to WiFi..");                /*prints on serial board*/
  }
  Serial.println("Connected to the WiFi network");


/**** Connecting to a mqtt broker**************************************************************************************/

  client.setServer(mqtt_broker, mqtt_port);                /*setting mqtt server*/
  client.setCallback(callback);                            /*calls function in response to an event. */

  while (!client.connected()) {
    String client_id = "esp32-client-";
    client_id += String(WiFi.macAddress());
    Serial.printf("The client %s connecting to the public mqtt broker\n", client_id.c_str());
    if (client.connect(client_id.c_str(), mqtt_username, mqtt_password)) {
      Serial.println("Public emqx mqtt broker connected"); /*connecting client*/
    } else {
      Serial.print("failed with state ");
      Serial.print(client.state());
      delay(2000);
    }

  }


/********** Publish and subscribe*****************************************************************************************/


 client.publish(topic_up, "We are Group 5!!!");        /*publishes to mqtt*/
 client.subscribe(topic_down);                         /*topic for subscription*/


  delay(2000);                                         /*wait for 2s*/


/*********READING BATTERY STATUS***************************************************************************************/
/**************calculating battery voltage*****************************************************************************/

 pinreading = analogRead(ADC_PIN);
  bat_voltage = ((float)analogRead(ADC_PIN) / 4095) * 3.3 * 2.2;                /*The equation is calibrated for accuracy*/
  Serial.print("value from pin:");

  Serial.print(pinreading);

  Serial.println("voltage:");
  Serial.print(bat_voltage);


/********Calculating battery percentage********************************************************************************/

 batt_percentage = (uint8_t)(((bat_voltage - BATT_MIN) / (BATT_MAX - BATT_MIN)) * 100);   /*Equation of percentage based on V*/

  if (batt_percentage > 100) {

    batt_percentage = 100;
  }
  if (  batt_percentage <= 0) {

    batt_percentage = 0;
  }
  Serial.println("battery percentage:");
  Serial.print(batt_percentage);


/********************MQ2 calibration and reading of data******************************************************************/

  Serial.print("Calibrating...\n");
  Ro = MQCalibration(MQ2PIN);                       //Calibrating the sensor. Please make sure the sensor is in clean air
  //when you perform the calibration
  Serial.print("Calibration is done...\n");
  Serial.print("Ro=");
  Serial.print(Ro);
  Serial.print("kohm");
  Serial.print("\n");

  Serial.print("HYDROGEN:");
  Serial.print(MQGetGasPercentage(MQRead(MQ2PIN) / Ro, GAS_HYDROGEN) );
  Serial.print( "ppm" );
  Serial.print("    ");
  Serial.print("LPG:");
  Serial.print(MQGetGasPercentage(MQRead(MQ2PIN) / Ro, GAS_LPG) );
  Serial.print( "ppm" );
  Serial.print("    ");
  Serial.print("METHANE:");
  Serial.print(MQGetGasPercentage(MQRead(MQ2PIN) / Ro, GAS_METHANE) );
  Serial.print( "ppm" );
  Serial.print("    ");
  Serial.print("CARBON_MONOXIDE:");
  Serial.print(MQGetGasPercentage(MQRead(MQ2PIN) / Ro, GAS_CARBON_MONOXIDE) );
  Serial.print( "ppm" );
  Serial.print("    ");
  Serial.print("ALCOHOL:");
  Serial.print(MQGetGasPercentage(MQRead(MQ2PIN) / Ro, GAS_ALCOHOL) );
  Serial.print( "ppm" );
  Serial.print("    ");
  Serial.print("SMOKE:");
  Serial.print(MQGetGasPercentage(MQRead(MQ2PIN) / Ro, GAS_SMOKE) );
  Serial.print( "ppm" );
  Serial.print("    ");
  Serial.print("PROPANE:");
  Serial.print(MQGetGasPercentage(MQRead(MQ2PIN) / Ro, GAS_PROPANE) );
  Serial.print( "ppm" );
  Serial.print("\n");
  delay(200);


/**** Reading temperature or humidity*******************************************************************************/

 float h = dht.readHumidity();                              // Read temperature as Celsius (the default)

 float t = dht.readTemperature();                           // Read temperature as Fahrenheit (isFahrenheit = true)

 float f = dht.readTemperature(true);                       // Read temperature as Fahrenheit (isFahrenheit = true)


  if (isnan(h) || isnan(t) || isnan(f)) {
    Serial.println(F("Failed to read from DHT sensor!"));    // Check if any reads failed and exit early (to try again).
    return;
  }


  float hif = dht.computeHeatIndex(f, h);                    // Compute heat index in Fahrenheit (the default)

  float hic = dht.computeHeatIndex(t, h, false);             // Compute heat index in Celsius (isFahreheit = false)

  Serial.print(F("Humidity: "));
  Serial.print(h);
  Serial.print(F("%  Temperature: "));
  Serial.print(t);
  Serial.print(F("°C "));
  Serial.print(f);
  Serial.print(F("°F  Heat index: "));
  Serial.print(hic);
  Serial.print(F("°C "));
  Serial.print(hif);
  Serial.println(F("°F"));

  client.loop();


/***********Publish message on MQTT as JSON *******************************************************************************/

  long now = millis();
  if ((now - lastMsg) > 5000) {
    lastMsg = now;

    doc["Temperature"] = t;
    doc["Humidity"]   = h;
    doc["Heat Index"] = hic;
    doc["CO"] = MQGetGasPercentage(MQRead(MQ2PIN) / Ro, GAS_CARBON_MONOXIDE);
    doc["Hydrogen"] = MQGetGasPercentage(MQRead(MQ2PIN) / Ro, GAS_HYDROGEN) ;
    doc["Smoke"] = MQGetGasPercentage(MQRead(MQ2PIN) / Ro, GAS_SMOKE);
    doc["LPG"] = MQGetGasPercentage(MQRead(MQ2PIN) / Ro, GAS_LPG);
    doc["Methane"] = MQGetGasPercentage(MQRead(MQ2PIN) / Ro, GAS_METHANE);
    doc["Propane"] = MQGetGasPercentage(MQRead(MQ2PIN) / Ro, GAS_PROPANE);
    doc["Alcohol"] = MQGetGasPercentage(MQRead(MQ2PIN) / Ro, GAS_ALCOHOL);
    doc["Battery Status"] = batt_percentage;

/**************************************************************************/


/*********CONVERTING JSON OBJECT TO BUFFER********************************************************************************/


   byte buffer[256];                                        //Predefined number//
    size_t n = serializeJson(doc, buffer);                  //Collects the data and converts into JSON
    client.publish(topic_up,  buffer, n, false);

    Serial.println("Published!");                           //Publishes data in JSON form to be accessed online


/********************DEEP SLEEP FOR POWER SAVING**********************************************************************/

    pinMode(GREEN_LED_PIN, OUTPUT);
    pinMode(RED_LED_PIN, OUTPUT);
    delay(500);

    if (bootCount == 0) /*Red light blinks only for the first reading while green light blinks for all other readings*/
    {
      digitalWrite(RED_LED_PIN, HIGH);
      bootCount = bootCount + 1;
    } else
    {
      digitalWrite(GREEN_LED_PIN, HIGH);
    }

    delay(3000);

    digitalWrite(GREEN_LED_PIN, LOW);
    digitalWrite(RED_LED_PIN, LOW);


/****************Wake and sleep esp32**********************************************************************************/

    esp_sleep_enable_timer_wakeup(TIME_TO_SLEEP * uS_TO_S_FACTOR);
    esp_deep_sleep_start();
  }

}


/*****************CALLBACK FUNCTION*************************************************************************************/

/****** The mqtt client calls a callback method on separate thread to main application thread.**************************/

void callback(char *topic, byte *payload, unsigned int length) {
  Serial.print("Message arrived in topic: ");
  Serial.println(topic);
  Serial.print("Message:");
  for (int i = 0; i < length; i++) {
    Serial.print((char) payload[i]);
  }
  Serial.println();
  Serial.println("-----------------------");


}

void loop() {                         /*left blank, to save battery. Since after each reading, the esp32 restarts*/


}


/****************** MQ2 Resistance Calculation ************************************************************************

  Input:   raw_adc - raw value read from adc, which represents the voltage
  Output:  the calculated sensor resistance
  Remarks: The sensor and the load resistor forms a voltage divider. Given the voltage
         across the load resistor and its resistance, the resistance of the sensor
         could be derived.


************************************************************************************/

float MQResistanceCalculation(int raw_adc)
{
  return ( ((float)RL_VALUE_MQ2 * (1023 - raw_adc) / raw_adc));
}

/***************************** MQCalibration **************************************************************************

 Input:   mq_pin - analog channel
 Output:  Ro of the sensor
 Remarks: This function assumes that the sensor is in clean air. It use
         MQResistanceCalculation to calculates the sensor resistance in clean air
         and then divides it with RO_CLEAN_AIR_FACTOR. RO_CLEAN_AIR_FACTOR is about
         10, which differs slightly between different sensors.

***********************************************************************************************************************/

float MQCalibration(int mq_pin)
{
  int i;
  float RS_AIR_val = 0, r0;

  for (i = 0; i < CALIBARAION_SAMPLE_TIMES; i++) {               //take multiple samples
    RS_AIR_val += MQResistanceCalculation(analogRead(mq_pin));
    delay(CALIBRATION_SAMPLE_INTERVAL);
  }
  RS_AIR_val = RS_AIR_val / CALIBARAION_SAMPLE_TIMES;            //calculate the average value

  r0 = RS_AIR_val / RO_CLEAN_AIR_FACTOR_MQ2;                     //RS_AIR_val divided by RO_CLEAN_AIR_FACTOR yields the Ro
                                                                 //according to the chart in the datasheet

  return r0;
}


/*****************************  MQRead ***********************************************************************************/

 Input:   mq_pin - analog channel
 Output:  Rs of the sensor
 Remarks: This function use MQResistanceCalculation to calculate the sensor resistance (Rs).
         The Rs changes as the sensor is in the different concentration of the target
         gas. The sample times and the time interval between samples could be configured
         by changing the definition of the macros.
/**********************************************************************************************************************/

float MQRead(int mq_pin)
{
  int i;
  float rs = 0;

  for (i = 0; i < READ_SAMPLE_TIMES; i++) {
    rs += MQResistanceCalculation(analogRead(mq_pin));
    delay(READ_SAMPLE_INTERVAL);
  }

  rs = rs / READ_SAMPLE_TIMES;

  return rs;
}


/*****************************  MQ Get Gas Percentage *******************************************************************/

  Input:   rs_ro_ratio - Rs divided by Ro
           gas_id      - target gas type
  Output:  ppm of the target gas
  Remarks: This function uses different equations representing curves of each gas to
           calculate the ppm (parts per million) of the target gas.
/**********************************************************************************************************************/

/***********************Calculations**********************************************************************************/

int MQGetGasPercentage(float rs_ro_ratio, int gas_id)
{
  if ( accuracy == 0 ) {
    if ( gas_id == GAS_HYDROGEN ) {
      return (pow(10, (((log10(rs_ro_ratio)-1.41)) / (-0.47))));              //Numbers obtained from the Table 1 on MQ2 page
    } else if ( gas_id == GAS_LPG ) {
      return (pow(10, (((log10(rs_ro_ratio)-1.425)) / (-0.45))));
    } else if ( gas_id == GAS_METHANE ) {
      return (pow(10, (((log10(rs_ro_ratio)-1.34)) / (-0.37))));
    } else if ( gas_id == GAS_CARBON_MONOXIDE ) {
      return (pow(10, (((log10(rs_ro_ratio)-1.51)) / (-0.34))));
    } else if ( gas_id == GAS_ALCOHOL ) {
      return (pow(10, (((log10(rs_ro_ratio)-1.31)) / (-0.37))));
    } else if ( gas_id == GAS_SMOKE ) {
      return (pow(10, (((log10(rs_ro_ratio)-1.61)) / (-0.44))));
    } else if ( gas_id == GAS_PROPANE ) {
      return (pow(10, (((log10(rs_ro_ratio)-1.29)) / (-0.46))));
    }
  }

 else if ( accuracy == 1 ) {
       if ( gas_id == GAS_HYDROGEN ) {
      return (pow(10, (((log10(rs_ro_ratio)-1.41)) / (-0.47))));                //Numbers obtained from Table 1 on MQ2 description
    } else if ( gas_id == GAS_LPG ) {
      return (pow(10, (((log10(rs_ro_ratio)-1.425)) / (-0.45))));
    } else if ( gas_id == GAS_METHANE ) {
      return (pow(10, (((log10(rs_ro_ratio)-1.34)) / (-0.37))));
    } else if ( gas_id == GAS_CARBON_MONOXIDE ) {
      return (pow(10, (((log10(rs_ro_ratio)-1.51)) / (-0.34))));
    } else if ( gas_id == GAS_ALCOHOL ) {
      return (pow(10, (((log10(rs_ro_ratio)-1.31)) / (-0.37))));
    } else if ( gas_id == GAS_SMOKE ) {
      return (pow(10, (((log10(rs_ro_ratio)-1.61)) / (-0.44))));
    } else if ( gas_id == GAS_PROPANE ) {
      return (pow(10, (((log10(rs_ro_ratio)-1.29)) / (-0.46))));
    }
  }
  return 0;
}
6. Results
Serialboard
 |
|---|
| figure 6 |
Grafana
 |
|---|
| figure 7 Measurement result of DHT22 and MQ2 sensors visualized on Grafana |
7. Conclusion
Using a low cost Arduino Kit and integrating the ESP32 micro controller, we were able to accomplish three tasks. The first was to measure different Air Quality parameters such as temperature, humidity and particulate matter. By using the MQ2 sensor, we were able to measure the ppm of the following gasses: H2, CH4, CO, Alcohol, Propane, LPG and smoke. However depending on the source or literature it is possible to find multiple threshold limits of inhalation that produce adverse health effects on humans. Therefore we could further expand the project to have both a more sensitive sensor and a predefined threshold limit that will warn the user of the device of any potential health hazards. As of right now the user is only able to monitor the amount of particulate matter within the scope of the sensor. Secondly we were able to transmit data using a publish-subscribe broker. By using MQTT we were able to create topics that contained the data received by the Arduino sensors, later with the help of the Node Red software, we created a flow chart in which the data input from the topic and utilizing the JSON format, was sent to Grafana where the data was ultimately transformed visually for easy interpretation. We decided to keep one topic containing all the data, because the idea is to have multiple Air Quality devices running simultaneously but each having its own independent topic. That would help us identify easier any issues with any of the devices. Lastly we successfully operated the device using a 9V battery and integrated the following components and features for improved performance: A linear voltage regulator that lowered the voltage to within the 5V usability of the ESP32 micro controller. A voltage divider that allowed us to measure the battery's charge and continuously kept track of the battery's life, which was also transmitted in the data to the broker for later observation in Grafana. And ESP32's capability of going into deep sleep at our selected time intervals to limit power consumption and to extend the battery's life. However, we found that the 9V battery was not the best option for this project, but we kept it because it made us integrate components and features that we would not have otherwise thought about using if we have had a more robust and capable battery.
We thus demonstrate that devices with the purpose of monitoring air quality can be built easily and cheaply. In addition, we explained the steps taken by us in this project and expanded on how the components work. We hope that his work can help inspire new students and hobbyists in their pursue of producing devices that have the following characteristics:
- Collection of data
- Programming software
- Transmission of data and usage of brokers
- Electronics
- Reporting through wikis
- FUN!
8. Discussion
For discussion we want to talk about two things, one is how we can improve our device and the second is what issues are presented during the current set-up and how it affects its performance.
To start we are going to look at the current issues. Due to the idea of having a system that is easy to set up and needs as little investment as possible, we have opted for the exclusion of parts that could in the future aid in the performance of the device for both battery consumption and accuracy in the data registered. The main issue comes from the utilization of the 9V battery provided in the ELEGOO kit. That specific battery doesn’t hold a large charge. For the 6F22 which is the model of our battery, meaning that is based on Zinc-Carbon material, the average capacity is limited to about 400mAh. Additionally they are not suitable for recharging and the efficiency and durability is highly influenced by ambient temperature. Moreover, because the voltage is higher than the required by the ESP-32 microcontroller, it means that we can either use the internal resistor of the microcontroller or an external linear regulator or a switcher, however for any of these options there is going to be loss of energy in the form of heat produced by the resistance. What we would like is to have is a rechargeable battery that holds more power and is set up to provide 3.3 to 3.7V. In addition the inclusion of a PV module, which will recharge the battery, however still the main purpose of the device is to measure the air quality of enclosed spaces, therefore consideration must be put into the installation and placement of the PV module, and whether it makes sense to use it or not. High quality sensors are available that can not only measure specific compounds but will yield better results. One which would be good to add to our device would be the MQ-131 Ozone sensor. Ozone is produced by multiple household products, such as steamers, air purifiers and ultraviolet lamps. The indication of high levels of Ozone in a confined space could cause a health hazard for anyone within that space. The price of the sensor is $38 on amazon.com. That highly elevates the overall cost of the project and was deemed not suitable.
Issues with the current set-up are based on the components and its limitations. For example the MQ-2 sensor needs to be active and heat up for a period of 24 hours before the reading to increase its accuracy. Due to its requirements, power consumption is increased. Additionally, the calibration of the device is undefined, meaning that It can be adjusted individually to meet specific requirements. The use of RTC memory to reduce WiFi connections is an option that has two effects. One is the reduction of power consumption due to the sending of information in bulk packages and the other is the inability to obtain information due to the lapse time between connections. RTC memory is used to store information during Deep Sleep mode. Since the main memory of the microcontroller is wiped when it goes to sleep, the sensors can instead take the readings and the data is stored on the RTC without the need of doing one reading followed by one WiFi transmission. For example if we set up the device to do 10 readings per hour, instead of connecting the device to the WiFi 10 times to transmit the data, it can instead connect only once every hour and send the 10 readings in one package. That would considerably reduce the power consumption, however, if as in the previous example we would have the opportunity of having more up to date information, every 10 minutes of the Air Quality, alternatively we would have to wait an hour to know what were the readings during that time. Since we opted for a system that gives you the latest information we avoided using RTC memory.
9. Video Explanation
10. References
Measuring the Temperature, Humidity, smoke, Carbon Monoxide(CO), and Liquified petroleum gas(LPG) in the air.
Bogdan, Mihai. (2016). How to Use the DHT22 Sensor for Measuring Temperature and Humidity with the Arduino Board. ACTA Universitatis Cibiniensis. 68. 10.1515/aucts-2016-0005.
1)
World Health Organization. https://www.who.int/health-topics/air-pollution#tab=tab_1
amc2022/grouph/start.txt · Last modified: 2022/09/10 21:53 by gustavo001