Table of Contents
Group S: Room Climate Station
A project by Emilie Streichsbier
Introduction
A healthy work environment is important and has a huge impact on productivity. According to the Umweltbundesamt the air quality is poor if the CO2 concentration is above 1400 ppm. During the corona pandemic indoor CO2 levels were also utilized as an indicator for the risk of a covid infection. Airing out and venting communal rooms and workspaces became even more important to prevent the spread of covid. Having accessible sensors present in offices, classrooms or conference rooms displaying current CO2 levels is a helpful tool to determine when to ventilate and create a safer, more comfortable work environment.
Using an Elegoo Uno microcontroller board as its basis the system built in this project is meant to measure the room temperature, relative humidity, and carbon dioxide concentration in the air. Additionally, it should show the time. All those measures can help to decide when it is most reasonable to vent. Most importantly the measurements have to be displayed independently from the serial monitor in Arduino IDE to make the system mobile and usable in any room.
Methods and Materials
- Elegoo UNO
- LCD display 16×2
- DHT11 sensor module
- RTC DS1307 module
- MQ135 gas sensor module
- 10k potentiometer
- 220 ohm resistor
- Breadboards
- male-to-male jumper cable
Elegoo Uno
The Elegoo Uno is a microcontroller board that can be programmed with Arduino IDE. It has several pins than can be set as in or output for data by using different functions. By installing additional libraries into Arduino IDE the board is able to communicate with a variety of sensor modules and other microcontrollers the board has a great range of use.
How to use the Elegoo Uno
As mentioned above the Uno is programable with Arduino IDE. To program it you have to connect the board via USB. The written code can then be compiled and uploaded onto the microcontroller.
LCD Display
The LCD display can be used to print values obtained from the measurement of a sensor. It can be used instead of the serial monitor to make a system independent and mobile. The display needs a 5V power supply. Depending on how many of the pins are utilized it can either be used in 4-bit or 8-bit mode. Because of the limited availability of digital output pins on the Eleggoo Uno 4-bit or 4-wire mode is usually preferred.
How to use the LCD
The LCD module has 16 different pins connected to the board as shown in figure 1. The 10k potentiometer connected to the V0 pin can change the brightness and contrast of the display when being turned rather than setting the brightness to one particular level. To program the LCD the library LiquidCrystal needs to be installed. To test if the set-up works this example included in the library was used.
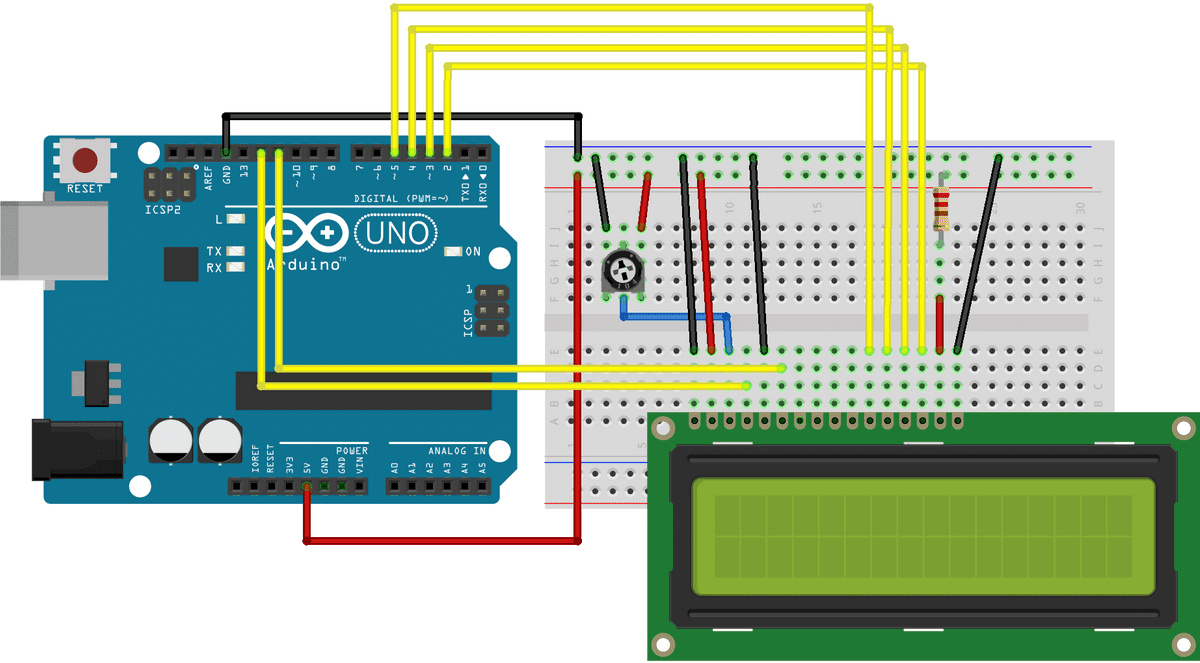 Fig. 1: LCD Set-up (Source: https://www.arduino.cc/wiki/static/7d7b6e99f40c7e55f2e9c6175c6db5b5/c1b63/LCD_Base_bb_Fritz.png
 // include the library code:
#include <LiquidCrystal.h>

// initialize the library by associating any needed LCD interface pin
// with the arduino pin number it is connected to
const int rs = 12, en = 11, d4 = 5, d5 = 4, d6 = 3, d7 = 2;
LiquidCrystal lcd(rs, en, d4, d5, d6, d7);

void setup() {
  // set up the LCD's number of columns and rows:
  lcd.begin(16, 2);
  // Print a message to the LCD.
  lcd.print("hello, world!");
}

void loop() {
  // set the cursor to column 0, line 1
  // (note: line 1 is the second row, since counting begins with 0):
  lcd.setCursor(0, 1);
  // print the number of seconds since reset:
  lcd.print(millis() / 1000);
}
DHT11 Sensor Module
The DHT11 is a sensor that can measure temperature and humidity. It is pre-calibrated and can measure temperatures between 0 – 50°C with an accuracy of ± 2°C and relative humidity between 20 – 90 % with an accuracy of ± 5%. The resolution for both is 16-bit. The sensor needs a power supply of 3V and up to 5.5 V and during measurement has an operating current of 0.5 mA up to 2.5mA. The sensor can be seen in figure 2

How to use DHT11
In order to use the sensor module, it has to be appropriately connected to the microcontroller board. The module has three pins, VCC, Ground and a data pin (see figure 2). The VCC is connected to the 5V power outlet, GND is connected to GND and the data pin is connected to a digital output pin.
To program the sensor the right Arduino library has to be installed, in this case the DHT.h library. To test if the sensor was set up properly the following code was used. The heat index was mainly included to test printing characters in as many positions of the LCD as possible and would later be replaced with the CO2 concentration.
#include <DHT.h>
#include <LiquidCrystal.h>

 // DHT11 sensor
#define DHTPIN 8 // digital pin the sensor is connected to
#define DHTTYPE DHT11  // DHT 11
DHT dht (DHTPIN, DHTTYPE); // Initialize DHT sensor.

 // LCD display
LiquidCrystal lcd(12, 11, 5, 4, 3, 2); // pins the display is connected to

void setup() {

dht.begin();
lcd.begin(16, 2);

}

void loop() {
   delay(10000);

float temp = dht.readTemperature(); // Read temperature in celcius
float hum = dht.readHumidity(); // Read relative humidity in %
float hi = dht.computeHeatIndex(temp, hum); // Heat index gives the temperature that is felt by humans; depending on temp. & humidity

lcd.setCursor(0,0); // setCursor function sets where the text start 0 is the first line and first field
lcd.print("T=");
lcd.setCursor(2,0);
lcd.print(temp);
lcd.setCursor(4,0);
lcd.print((char)223); // prints degree symbol
lcd.print("C ");
lcd.setCursor(0,1);
lcd.print("H=");
lcd.setCursor(2,1);
lcd.print(hum);
lcd.setCursor(4,1);
lcd.print("%  ");
lcd.setCursor(8,1);
lcd.print("HI=");
lcd.setCursor(11,1);
lcd.print(hi);
}
MQ1355 Sensor Module
The MQ 135 is a sensor that measures the concentration of CO2 and other gases in air. It needs a 5V power supply to operate and has a working current of 150mA. The module has one digital and one analog pin for data output. The material used to sense the gas concentration is SnO2 which is a metal oxide semiconductor which changes its resistance in contact with gases. R0 is the internal resistance of the sensor in clean air, and RS is the resistance of the sensor in contact with different gases. With the R0 and RS values the concentration in ppm can be calculated. The stainless steel mesh layer as seen in figure 3 is there to protect the sensor from particular matter and other disturbances.

How to use MQ135
To program the sensor the installation of the MQ135 library is necessary. By adding the following piece of code, the sensor was integrated into the system. The resistance, as well as the calculated concentration in ppm, are dependent on the humidity and temperature and therefore the values obtained by the DHT11 had to be included. To get reasonable data the sensor had to be calibrated first. The exact calibration process is described in the section Results and Discussion.
float rzero = mq135.getRZero(); // Resistance in clean air
float corrzero = mq135.getCorrectedRZero(temp,hum);
float res = mq135.getResistance(); // RS
float corrres = mq135.getCorrectedResistance(temp,hum);
float ppm = mq135.getPPM();
float corPPM = mq135.getCorrectedPPM(temp,hum); // gas concentrations are highly dependent on humidity and temperature
RTC DS1307 Module
The DS1307 is a real-time clock module which can be used to measure time. Once the RTC is initialized by setting it to the current time including year, month and day of the week it continuously counts time. It needs a supply voltage of 5V. If the main power source is disrupted the RTC switches its power supply to a 3V button battery to ensure the continuous measurement of time.

How to use DS1307
To access the current time the RTC has to be set once. To set it with the serial monitor this code was used. The Wire library and later to access and display the time the libraries DS1307RTC, DS1307 and TimeLib had to be installed.
 Fig. 5: Setting the time in the serial monitor
The project went through different development phases. The circuit as well as the code have been changed over time. Every sensor was tested separately before combining the system together. At first, the LCD display was set up as the basis of the project as described above. Then the DHT11 was added next. After that, the RTC was initiated and incorporated to print the time on the LCD. Lastly, the MQ135 was calibrated and added to the system. Initially, the LCD showed the heat index obtained by the DHT11, which was replaced by the CO2 concentration. Because of lacking space on the display, the concentration is not displayed with its appropriate unit (ppm) and CO2 had to be abbreviated as “C”. The calibration and troubleshooting process for the MQ135 is further described in the chapter Results and Discussion.
Results and Discussion
As described above the building of the system was done stepwise to make sure that the functionality of each part was understood and everything was working correctly. The final set-up included two breadboards because the LCD took up more space than expected. In figure 6 the exact setup can be seen. The first line of LCD displayed the room temperature in Celsius and the hours and minutes. The second line shows the relative humidity in percent and the CO2 concentration in ppm. Due to limited space, the unit could not be displayed.
 Fig. 6: Final set-up (Taken by Emilie Streichsbier)
The resulting schematics of the final composition can be seen in figure 7.
Fig. 6: Final set-up (Taken by Emilie Streichsbier)
The resulting schematics of the final composition can be seen in figure 7.
 Fig. 7: Schematics of the room climate station, created with fritzing
The code was written in a similar way though it was mostly one piece of code that was expanded over time.
Fig. 7: Schematics of the room climate station, created with fritzing
The code was written in a similar way though it was mostly one piece of code that was expanded over time.
#define DS1307_ADDRESS 0x68
#include <DHT.h> // Library installed to use the the DHT11 sensor
#include <MQ135.h> // Library needed to use MQ135 gas sensor
#include <LiquidCrystal.h> // Library for LCD set-up
#include <TimeLib.h> // Library to access time functions
#include <DS1307RTC.h> // library to use the RTC module
#include <Wire.h>
#include <DS1307.h>

// Set-up of the differernt compartments

// DHT11 sensor

#define DHTPIN 8 //digital pin the sensor is connected to
#define DHTTYPE DHT11  //DHT 11
DHT dht (DHTPIN, DHTTYPE); //Initialize DHT sensor

// MQ135 sensor

#define PIN_MQ135 A0 // analog pin the sensor is coneccted to
MQ135 mq135 (PIN_MQ135); //initilaize MQ135 Sensor

// LCD display

LiquidCrystal lcd(12, 11, 5, 4, 3, 2); // pins the display is connected to


void setup() {

// Serial.begin(9600);
dht.begin();
setSyncProvider(RTC.get);
}

void loop() {
 delay(10000);

float temp = dht.readTemperature(); // Read temperature in celcius
float hum = dht.readHumidity(); // Read humidity %

float rzero = mq135.getRZero(); // Resistance in clean air
float corrzero = mq135.getCorrectedRZero(temp,hum);
float res = mq135.getResistance(); // RS
float corrres = mq135.getCorrectedResistance(temp,hum);
float ppm = mq135.getPPM();
float corPPM = mq135.getCorrectedPPM(temp,hum); // gas concentrations are highly dependent on humidity and temperature


Serial.print(hour());
Serial.print("Temerature: ");
Serial.print(temp);
Serial.print("*C\t");
Serial.print("Humidity: ");
Serial.print(hum);
Serial.print("%\t");


// LCD display  //things printed on the LCD diplay

lcd.begin(16, 2); // display dimensions
lcd.setCursor(0,0); // setCursor function sets where the text start 0 is the first line and first field
lcd.print("T=");
lcd.setCursor(2,0);
lcd.print(temp);
lcd.setCursor(4,0);
lcd.print((char)223);
lcd.print("C ");
lcd.setCursor(0,1);
lcd.print("H=");
lcd.setCursor(2,1);
lcd.print(hum);
lcd.setCursor(4,1);
lcd.print("%  ");
lcd.setCursor(7,1);
lcd.print("C=");
lcd.print(corPPM);
lcd.setCursor(9, 0);
lcd.print(hour());
lcd.print(":");
lcd.print (minute());
}
The system was working and producing seemingly reasonable data until the MQ135 was introduced. The CO2concentration replaced the initially shown heat index. Two things changed:
- Temperatures did not correspond with outside temperatures. When the DHT11 was about 1 meter away from a window that had been open for several hours the measured temperature deviated from the outside temperature by at least 3 - 5 degrees.
- The relative humidity suddenly was lower than during any test before. Usually varying from 45 to 60% it suddenly never measured a value over 40% even when placed in rooms with higher humidity.
As the MQ135 heats up significantly when in use this might be an explanation for the changed results of the DHT11. To test that the MQ135 was removed from the breadboard to eliminate the suspected interference. The DHT11 still measured temperatures that were unrealistic. Right next to an open window and an outside temperature of 20°C the sensor showed a temperature of 25°C. Even with the expected margin of error that measurement is not reasonable. The humidity measurements seemed to improve, returning to their previous range between 45 and 60%.
Additionally, the CO2 concentrations were always above the recommended 1400 ppm. Often the measurement was well over 3000 ppm even after airing out for a long period of time. According to the MQ135 datasheet the sensor needs a period of up to 48 hours to preheat. But even after over 96 hours without interruption, the measurements were still too high.
Additional sources suggested that the MQ135 had to be calibrated by heating up and then measuring and manually correcting the given R0 in the MQ135 library. After changing the R0 from originally 76.63 to 45.68 the quality of the measurement did not increase. This code was used to obtain the new R0 displayed in the serial monitor. The value was only changed after the sensor ran for at least 24 hours undisturbed and did not change anymore.
#include "MQ135.h"
void setup (){
Serial.begin (9600);
}
void loop() {
MQ135 gasSensor = MQ135(A0); // Attach sensor to pin A0
float rzero = gasSensor.getRZero();
Serial.println (rzero);
delay(1000);
}
Lastly, the sensitivity of the sensor module was adjusted by turning the on-board potentiometer on the back of the sensor module. With each change in sensitivity, the sensor ran for at least one hour. Although there was a definite change in the measurements even at the lowest sensitivity the value for the CO2 concentration was constantly above 1200 ppm at first.
After randomly pulling the plug and putting it back in the concentration varied between 350 and 1000 ppm at the lowest sensitivity setting. It cannot distinctly be concluded what improved the sensor’s measurements. Even though the obtained values for the CO2 concentration seem much more appropriate, it cannot be said for sure whether they are correct or not.
Conclusion and Outlook
All in all, the system is functional. The communication between the sensors, the microcontroller and the LCD is working. It is unsure how accurate the obtained measurements are but as it is the system could be used as tool to give meaningful information and improve indoor air quality.
Building and expanding the system stepwise helped to understand the different components and the code better. If this same project had to be recreated a bigger LCD and a more controllable environment to calibrate and set-up the gas sensor would be recommended. The bigger LCD would increase the accessibility and even more variables could be displayed. Additionally, things like the unit of CO2 concentration could be included with no problem.