Table of Contents
Introduction to IoT - Sensors and Data processing
The first steps into the topic of IoT can be very confusing or even overwhelming. In this article, I want to walk you through an example, where you can see how to gather data, which hardware and software you can use, and how it all connects together in the end. You won't need any programming knowledge whatsoever. But I expect you have some idea what a microcontroller is and maybe have programmed something simple like an Arduino Uno with a blink example. Just so you have a general idea of a microcontroller.
Intro
What is IoT?
IoT, the Internet of Things is a very big topic. So we are going to break a bit down. Even the IEEE has to confess that “looking for a comprehensive definition of Internet of Things is not easy” (IEEE Internet Initiative, 2015). But that doesn't mean it can't be done. The IEEE list 9 features that make up the Internet of Things:
- Interconnection of Things
- Connection of Things to the Internet
- Uniquely Identifiable Things
- Ubiquity
- Sensing/Actuation capability
- Embedded intelligence
- Interoperable Communication Capability
- Self-configurability
- Programmability
If you want to know in detail what all these mean precisely please read the paper I linked below by the IEEE Internet Initiative (May 2015) chapter 5.3 Features and Definition of Internet of Things.
The most important things for us are the Interconnection of Things, the Connection of Things to the Internet, Uniquely Identifiable Things, and the Sensing capability. We will get to all these topics today.
What you will need
You will need some stuff to get started with this little project. If you are a student of Prof. Becker you will get all this stuff from him. If you have just stumbled across this article you, unfortunately, have to set up and buy everything yourself. So what you will need:
- Your NIG (a running and configured instance of Node-Red, InfluxDB, and Grafana)
- A Breadboard with some Jumper wires
- An ESP8266 (here: adafruit HUZZAH)
- An FTDI Programmer (only if your board doesn't come with a USB to serial converter ( eg doesn't have USB-Connector
))
- A USB cable for the programmer (or the ESP8266 directly)
- A DS18B20 (Digital temperature sensor)
- A 4.7k resistor
- A PC with the Arduino IDE and ESP8266-boards installed
NIG
Node-Red, InfluxDB, and Grafana is commonly used tech-stack. To learn more about it, please read this article and follow the instructions to set things up like described: First steps with your NIG
Breadboard
A Breadboard can be used for prototyping. 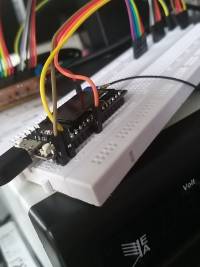 It allows connecting cables by just plugging them into the holes, as you can see in the picture. Many devices like microcontrollers or sensors have a pin spacing that allows them to be plugged directly into the board as well. So you can prototype circuits and test around.
If you want (or need) to learn more you can watch this video:
ESP8266
The ESP8266 is a cheap microcontroller that comes on many different carrier boards. On the HUZZAH board, they are easy to differentiate. The ESP8266 is the black PCB and the carrier board is the blue PCB. The carrier board is just needed so can plug it into a breadboard for example. Most of the time they have some other components on them like LEDs and Buttons. These are sometimes needed for programming and debugging. Some boards even have more components on them, like a camera or a small display.
The ESP8266 has some special functionality, most importantly for us: it has WiFi built-in. We (by that I mean Tasmota) will use WiFi to transmit the data.
A more in-depth guide can be found here:
FTDI Programmer
The FTDI Programmer or more general a USB-to-TTL Adapter is needed for programming some of the more advanced microcontrollers. Some boards already include them on the board, but because it is only needed for programming it is really unnecessary to have it on the PCB during operation. Not that beginner-friendly, I know, but some time ago we had a workshop with students from 7th grade and they managed to do this after a short explanation.
DS18B20
maxim integrated describes their sensors as follows: “The DS18B20 digital thermometer provides 9-bit to 12-bit Celsius temperature measurements […]. The DS18B20 communicates over a 1-Wire bus that by definition requires only one data line (and ground) for communication with a central microprocessor.” In theory, the sensor could get power over the data line but we will also use the third pin for power. This will result in a more reliable usage.
What you will do
Today we are going to build a simple example with one digital temperature sensor. This temperature sensor will be connected to an ESP8266 which will run an open-source community-driven firmware called Tasmota. We want to use this because we then do not need to code anything. The microcontroller will then send the data periodically to a so-called MQTT broker. This will allow Node-Red to pick up your data and place it in the influxdb where it gets saved. Grafana can then access the data, even historic ones, and display it in a nice graph. This concept can be adapted to many different sensors.
Doing stuff
Allons-y!
DS18B20 Pinout
- Cable VErsion: red → 3.3V , blue → GND , yellow → data (1wire protocol)
- Breakout board version: “+” → 3.3V , “-” → GND, out → data
Breadboard prepartion
So get all your stuff together and build up the breadboard. Here is the schematic. If your Programmer has male headers, you can plug it directly into the breadboard. 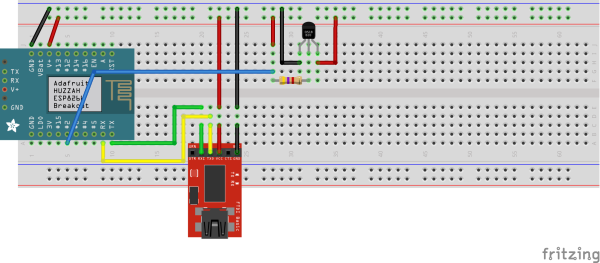
The data line of the 1Wire bus (blue)
is not connected correctly in the diagram above!
Installing the Tasmotizer
Tasmotizer is “The full-featured ESP8266 flashing tool for Tasmota.” (2019, Ziółkowski). This tool makes it very easy to flash tasmota onto an ESP8266. But before we can use it, we need to install it on our machines. There are multiple options:
- Windows Standalone
- pip
- clone the repo
In this article, I will go with option 3: clone the repo Just follow these few steps:
- Download the repo from Github: Tasmotizer on Github OR clone it with the command line git interface:
git clone https://github.com/tasmota/tasmotizer.git - For the next steps make sure pip and python3 are installed. To check this, you can use these two commands:
pip -Vandpython3 -V. On Ubuntu systems, these should be installed by default. Next, go into the folder where you extracted or cloned Tasmotizer into. We need to install some dependencies. For this just use this command:pip3 install -r requirements.txt. This will install all packages mentioned in therequirements.txt. - To start Tasmotizer just use this command now:
python3 tasmotizer.py
You are now ready to start tasmotizing! 
Tasmota
I now mentioned Tasmota multiple times but never explained what it really is. I think now is a good time to do that.
Tasmota offers “Total local control with quick setup and updates. Control using MQTT, Web UI, HTTP or serial. Automate using timers, rules or scripts. Integration with home automation solutions. Incredibly expandable and flexible.” (Tasmota Community) It all started because someone wanted to hack a device for home automation. Most of the time these are bound to the cloud. This really sucks (to be honest). So he started writing his own firmware for it. Even tho there are many home automation devices out there made by companies, some of them rely on the ESP8266, which is used quite frequently in the maker space. And if there is an ESP8266, then you can flash it (if you want). If you want to learn more about Tasmota take a deep dive into the docs: Tasmota Docs
Flashing Tasmota with Tasmotizer
We are not going to flash some finished product (unfortunately 
So first plugin in your programmer into your PC where we just installed Tasmotizer. If not already done, open Tasmotizer like mentioned above. You will be greeted with a window like this: 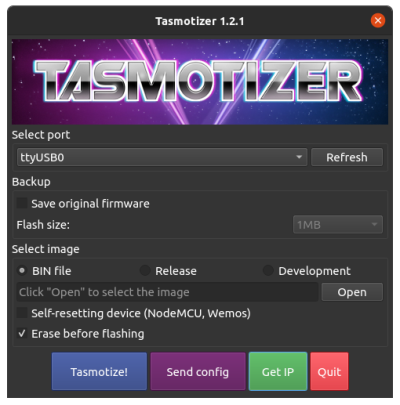
- First select the USB Port, in which you just attached the programmer. On Ubuntu, it will be something like
ttyUSB0or some other number than0. - Don't select
Select original firmware. This is good if you have a real product where you may want to go back to the factory state. We don't need this here. - Under
Select imageWe could now download the latest firmware from GitHub ourselves or we just select the optionRelease. We can leave the option astasmota.bin. This should be the latest firmware available. There are also other binaries available. These have most of the time some special functions included. We don't need them here right now. If you are interested in all the options you have to take a look at the documentation. - The Huzzah Board we have is not a
Self-resetting deviceso we, unfortunately, cannot tick this option. The last optionErase before flashingcan be left as default. - If you did everything correctly, you can now hit
Tasmotize!. This will then start the flashing process. First, it will download the firmware you selected. Then it will start the erasing process. Because the Huzzah is not a self-resetting device we have to bring it into the programming mode. Therefore you have to keep pressing theGPIO0Button (on other boards it is sometimes calledPROG), then hit theReset(or sometimesRST) once and then you can let go of the other button. The ESP8266 is now in programming mode. From a technical perspective, you have just pulled theGPIO Pin 0toGround / GNDwhich gets detected on start by the ESP8266, and it then goes into programming mode. If you have done that Tasmotizer will erase the current firmware and flash on the one.
Tasmota is now installed on our ESP8266. Hit the Reset one more time to power cycle the device.
Configure Tasmota - Part 1
We now need to configure Tasmota. This is partly done in Tasmotizer and partly done in a web UI.
With the ESP8266 still attached, you can click on Send config. A new window will appear.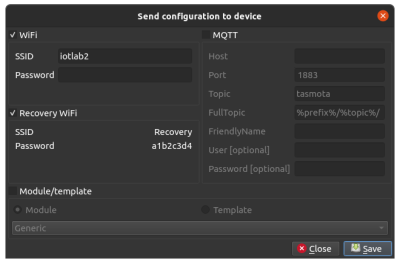 We are going to use them to set the WiFi credentials. For later use the
 Recovery WiFi-Option could be helpful. When the ESP8266 can not connect to the configured WiFi, it will open up a WiFi-Hotspot. You can then connect to it and make configuration changes. We will not use the other options in the Send config window.
So for now just activate WiFi and type in your desired WiFi credentials. Then hit Save. Tasmotizer will now upload the config to the Tasmota firmware on the ESP. The device will automatically restart after that, to apply the new configuration.
After the restart, the ESP8266 will try to connect to our configured network. If we've done everything correctly this should take only a couple of seconds. Because the rest of the configuration happens in a web UI, we have to find out the IP of our ESP. Tasmotizer has a cool feature for that. Just click Get IP, and you will get the IP displayed. Copy it to the URL bar in your browser and open up the page.
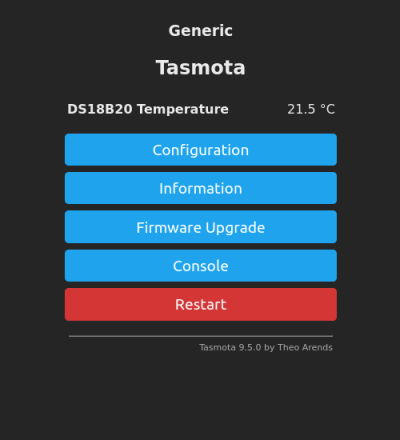
We will be greeted with this page:
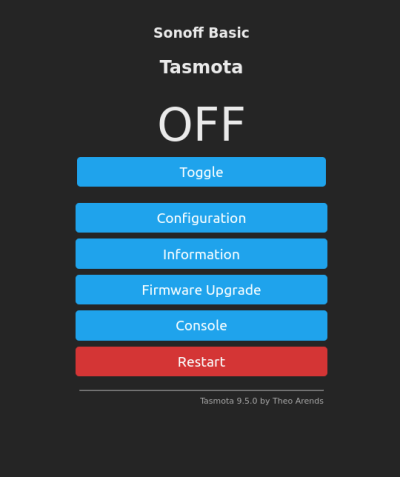 First we need to go into
 Configuration -> Configure Module. Because we are using a generic ESP8266, we have to choose under Module type the module Generic (0). Then we need to save the configuration. The ESP will restart and we then need to go back into the same menu. There, we now have more GPIO options. I attached the DS18B20 to GPIO2. If you don't know which pin is which on your particular board, you will have to google the pinout for it yourself. Either way, I will select for GPIO2 the option DS18x20 and hit Save. After the ESP has restarted we can go back to the menu. If we've done everything correctly you will get the temperature measured by the sensor displayed in the main menu. All that without coding. Great right?
But wouldn't it be even better if we could have a nice little graph of the temperature on the internet?
Configure Tasmota - Part 2
Before we can go on with displaying our data on the internet, we need to configure MQTT with our ESP. All you have to know about MQTT is basically, that it is a TCP protocol where you can publish messages on a specific topic and other machines can subscribe to these. It is commonly used in IoT because of its ease of use. All this communication is handled by a so-called MQTT Broker. A Server in simpler terms. For this example, we can use a free MQTT Broker. In production you wouldn't do this, because everyone could subscribe to our topics and so could excess our data.
To configure MQTT on our ESP8266 we need to go to Configuration -> Configure MQTT. We will use this free MQTT-Broker: Hivemq - The public MQTT broker. The Host is broker.hivemq.com. The Port (and all the other option to be honest) can be left as default (1883). After saving the new configuration we can go back to the main menu. There we can open up the Console. On the console, you can see all the debug and log messages that Tasmota spits out. Most of the messages will be published on specific MQTT topics. So if you would really want to you could subscribe to all of these and monitor the device remotely.
Tasmota has a preconfigured rule which will publish the sensor data of our sensor every 5 minutes to a specific topic. If you want to learn more about rules you should read this page: Tasmota Docs - Rules. With rules, you could react to different temperatures. So maybe send a message when the temperature falls under a specified threshold. You could also define another interval for sending the sensor data like this:
Rule1 ON Time#Minute|5 DO backlog publish %prefix%/%topic%/SENSOR %value% ENDON
I will not go into detail here. This is just for reference. If you really want to know how to utilize rules read the documentation linked above.
The only thing we now need from Tasmota is the topic, on which the sensor data get published. The easiest way to do this is to watch the console. First, open up the console. Somewhere should be a line which includes: MQT: tele/tasmota_1A4332/SENSOR. All lines with MQT state that something is happening with MQTT. The rest after the MQT is the MQTT topic. This will be different on every Tasmota instance. At least the part in the middle, because this is a randomly generated name for your specific ESP. I found the line in my console and it looks like this:
10:51:01.412 MQT: tele/tasmota_1A4332/SENSOR = {"Time":"2021-10-11T10:51:01","DS18B20":{"Id":"0000075EDD2C","Temperature":21.8},"TempUnit":"C"}
The part after the equal is the message. It includes a timestamp and the sensor data.
Making a graph
I hope yall have read the article and followed the steps for setting up your NIG. You are going to need it.
Node-Red
So in Node-Red, we have to start with an mqtt in node. If we open up the menu of that node, we first have to add a server. Click on the little pen icon next to the server field for that. We can then use the same server/host and port settings as before. Click Save to continue. Then we need to define the topic we want to subscribe to. For this, we just need to copy the topic from the Tasmota console, where we found it before. Something like this: tele/tasmota_1A3FCC/SENSOR. We can leave the QoS (Quality of Sevice) at default. Important Set Output to a parsed JSON object. Click Done. Now we need to extract the temperature from the message. The message will be formatted as a JSON-Object, which can hold values in key-value pairs. This can be easily extracted with two lines of javascript. So drag in a function node. Copy in these two lines of javascript:
let temperature = msg.payload.DS18B20.Temperature;
return { payload: temperature };
First we create a value temperature. The messages between all the nodes in Node-Red have the raw values in a key called payload. So we access the message with msg then in this JSON object we access the object called payload. This has the message in it we found earlier in the console. So we can access the object DS18B20 and last the key Temperature to get the sensor value. We then pack everything in our own little message object with just the raw number value as a payload. This will be returned, so send to the next node.
The last node we need is the influxdb out-node. Attach this to the output of the function node. Here you just need to select your influxdb and give the measurement a name that is easily distinguishable. I choose lab_temperature. You can now deploy your flow by selecting Deploy. Your flow should look something like this:
Grafana
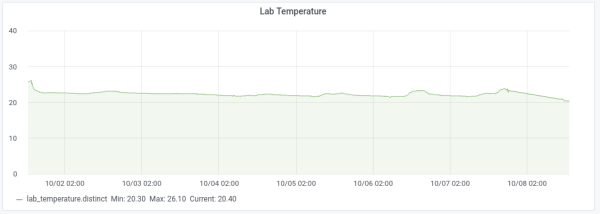
We are nearly finished! Let's open up Grafana. Start with creating a new dashboard by hovering over “plus”-icon on the left side of the screen and select Dashboard. Add a new panel. In the query-part select under FROM -> select measurement the value name you gave the measurement in Node-Red. Under SELECT remove mean() and put in distinct, so you get a nice line graph. We can now do some more advanced stuff. We know that the lab temperature will always be in a range from 0 to 40 degrees. When we open up the tab Axes on the right side, we can set for Left Y (so the left Y-axis) the Y-Min to 0 and the Y-Max to 40. You can also change the name of the graph under Settings-tab. Click Save and Apply if you are finished and that's it. Look at your nice little graph!
I hope you learned something today!

